

Translate this page into:
Electrocardiogram as a Tool to Predict Diastolic Dysfunction in the Early Hypertensive Patients and its Comparison in Males and Females
*Corresponding author: Kapil Karthikeya, Department of Cardiology, Nizams Institute of Medical Sciences, Hyderabad, Telangana, India. kapilkarthik1@gmail.com
-
Received: ,
Accepted: ,
How to cite this article: Karthikeya K. Electrocardiogram as a tool to predict diastolic dysfunction in the early hypertensive patients and its comparison in males and females. Indian J Cardiovasc Dis Women 2022;7:71-6.
Abstract
Objectives:
Heart failure with preserved ejection fraction continues to be a major healthcare challenge. Assessment of diastolic dysfunction (DD) is an integral part of the routine cardiologic examination, however little is known about ECG changes in diastolic dysfunction. several resting ECG parameters have been investigated to predict left ventricular diastolic dysfunction (LVDD). The study aims to assess diastolic dysfunction in recently diagnosed hypertensive patients by echocardiography and to find the value of ECG-derived parameters in predicting diastolic dysfunction.
Materials and Methods:
One hundred and fifty hypertensive patients of less than 1-year duration were divided into two groups based on the presence or absence of diastolic dysfunction. ECG parameters such as P wave dispersion, QT and QTc interval, ventricular activation time, Tend P, Tend Q were analyzed in all patients, and correlation was done with echo parameters to assess diastolic dysfunction in both males and females.
Results:
In both men and women a significant correlation was found between p wave dispersion, ventricular activation time, Corrected QT interval, TendP, and, Tend Q in ECG with diastolic dysfunction on bivariate regression analysis. Multivariate regression analysis showed that p wave dispersion had a greater correlation with diastolic dysfunction when compared with other ECG parameters (r=0.88, R2=0.78).
Conclusion:
Analysis of certain ECG parameters especially p wave dispersion is of great value in predicting diastolic dysfunction in both men and women.
Keywords
Diastolic dysfunction
Electrocardiogram
P wave dispersion
Tend p
Tend Q
Ventricular activation time

INTRODUCTION
Hypertension is one of the leading chronic health conditions with 30–40% of adults being affected by it in the developing world.[1] Every third Indian adult has hypertension with a prevalence of around 30% in the country.[2]
Nearly, 50% of the patients diagnosed with heart failure (HF) have preserved ejection fraction. Morbidity and mortality in HFpEF are comparable to HF with reduced ejection fraction.[3] The incidence of HFpEF is higher in women compared to men.[4]
Sex differences: Females often have a higher E/e' in 2D echo and a higher left ventricular diastolic dysfunction (DD) at presentation when compared with men.[5] There are many gaps in understanding HF in women and no proper awareness and importance were given to this condition compared to coronary artery disease.[6] Women diagnosed with HF have a longer survival rate compared to men having HF and tend to have a significantly higher hospitalization rate with more symptoms compared to men with the same etiology.[7,8] Reduction in the left ventricular compliance with impaired relaxation precedes DD and HF. HFpEF is more frequently observed in women after menopause pointing toward a possible role of reduced estrogen levels in the left ventricular DD. Electrical repolarization pattern analyzed on the surface ECG has a significant correlation with mechanical activation of the left ventricle observed on 2D echocardiography.[9]
Most of the current non-invasive methods, we use to assess left ventricular stiffness, compliance, and filling pressures, are not direct and the values may differ significantly in the same person depending on the autonomic activity, changes in pre and afterload. Electrocardiographic (ECG) parameters are less affected by the hemodynamics, with fewer variations, and they are not dependent on the operator.[10]
ECG changes in DD were not very well known. Our study, therefore, aims to investigate the role of various ECG indices as a potential tool for predicting DD in hypertensive patients. In developing countries, there are gender differences in access to health-care facilities, female patients especially those who are in the younger and older age group living in remote areas distant from the hospital are more deprived of health-care facilities.[11] Using ECG indices to predict DD will be very much useful in these women living in remote areas with less access to distant tertiary health-care facilities.
MATERIALS AND METHODS
Our study was conducted to know the usefulness of ECG indices in predicting left ventricular DD diagnosed by 2D echo in newly diagnosed hypertensive patients.
The primary goals of our study were, to assess diastolic function in patients with new-onset hypertension by echocardiography, and to find the value of ECG-derived parameters in predicting DD. We also compared the usefulness of these ECG parameters predicting DD in males and females.
Our study is a prospective study conducted in the department of cardiology in a tertiary care hospital during the period from August 2021 to October 2021. The 150 consecutive patients with age more than 18 years, having primary hypertension of <1-year duration, were included in our study.
Patients with structural heart diseases, patients with acute coronary artery disease, patients with impaired left ventricular systolic function or right HF, patients with conduction system abnormalities, patients with secondary hypertension, and patients receiving antiarrhythmic medication or any drugs that may affect QT interval were excluded from the study.
Using an oscillometric device supported at heart level, blood pressure was recorded in both the arms at rest. A 12-lead ECG with high resolution was taken at rest, at 25 mm/sec speed and 1 mv/cm amplitude, with a high-pass filter and a low pass filter of 0.05 Hz and 150 Hz, respectively. Left ventricular DD was assessed by performing a conventional 2D echo and Doppler imaging.
The following ECG indices were analyzed in all patients.
QT and corrected QT (QTc) interval: This was measured from the starting point of the QRS to the point, where the T wave ends [Figure 1a]. QTc was calculated using Bazzet’s formula by dividing the measured QT with the square root of the RR interval.
T end P, and T end Q: These two parameters reflect the left ventricular mechanical diastole [Figure 1a]. T end P was calculated by subtracting PQ and QT intervals from RR interval and T end Q was obtained by subtracting QT interval from RR interval.
P wave dispersion: This is measured as the difference between the maximal P wave duration and the minimal P wave duration in the ECG. P wave duration was calculated from the starting point of the P wave to the end of the P wave crossing the isoelectric line [Figure 1b].Ventricular activation time: This was calculated by measuring the interval from the beginning of the QRS complex to the highest point of the R wave.
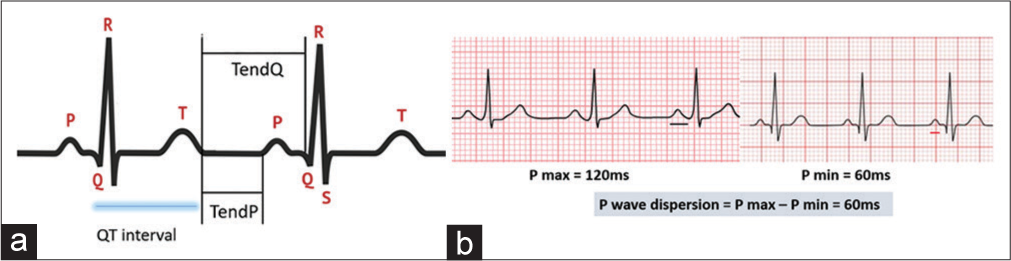
- (a) Pictorial depiction of QT interval, T end P and T end QT (b) P wave dispersion in ECG.
Using 2D echo, the left ventricle dimensions, thickness of septum, posterior wall, and ejection fraction were obtained in the parasternal long-axis view. In the apical four-chamber view, pulsed-wave Doppler was placed at the tip of mitral valve leaflets, and transmitral filling velocities of the left ventricle were obtained. Peak mitral flow velocity in the early diastole (E) and during atrial contraction (A) was obtained.
In apical four-chamber view, using tissue Doppler imaging of mitral annulus, peak velocity in early diastole (E0) and late diastole (A0) was measured. E/E0 ratio was calculated. Septal E/ E0 ratio of 8 or less is associated with normal pulmonary capillary wedge pressure (PCWP), values above 15 suggest elevated PCWP. Lateral annular E/E0 ratio is a good predictor of LV filling pressure. Lateral E/E0 ratio of at least 12 indicates elevated LV filling pressures in patients with preserved LV ejection fraction.
Statistical analysis
For statistical analysis, Microsoft Excel and SPSS software were used. Normally distributed continuous variables were represented in mean/standard deviation and comparison was done using unpaired two-sided t-test, whereas abnormal distribution was represented by medians/interquartile ranges and their comparison was done using Wilcoxon test. Categorical values were expressed as frequencies and percentages, analyzed using the Chi-square test. Bivariate and multivariate logistic regression analysis was used to evaluate the correlation and confounding factors that can influence the outcomes of the study. The Receiver Operator Characteristics (ROC) curve was drawn for each of these ECG parameters and a cutoff value was derived based on the best possible combination of sensitivity and specificity. P-value was considered as statistically significant if it is <0.05.
RESULTS
The study sample of 150 hypertensive patients was divided into two groups based on the presence or absence of DD into two groups. Among these, 42 patients had DD and 108 patients did not have DD. Twenty-one men out of 90 and 21 women out of 60 had DD (23% in men vs. 35% in women) (P = 0.1). Various demographic variables were analyzed in the two groups [Table 1]. There was no statistically significant difference in sex, presence or absence of diabetes, hypercholesterolemia, and BMI between both groups. A significant age difference was noted between the two groups. Patients having DD were of higher age when compared with patients who had no DD [Figure 2] (49.4 ± 5.5 vs. 43.5 ± 5.7) (P < 0.001).
| With-out DD (n=108) | With DD (n=42) | P-value | |
|---|---|---|---|
| Age | 43.5±5.7 | 49.4±5.5 | <0.001 |
| Sex (%) | |||
| Male | 21 (23) | 69 (77) | 0.11 |
| Female | 21 (35) | 39 (65) | |
| Diabetes | 22 | 12 | 0.22 |
| Hypercholesterolemia | 18 | 3 | 0.13 |
| BMI | 22.9±2.9 | 23.4±3 | 0.739 |
DD: Diastolic dysfunction, BMI: Body mass index

- Age distribution and diastolic dysfunction.
In both men and women, there was a significant correlation between P wave dispersion, ventricular activation time, QTc interval, T end P, and T end Q in ECG with the presence or absence of DD detected using 2D echo, on bivariate regression analysis [Tables 2 and 3]. Multivariate regression analysis demonstrated that P wave dispersion had the best correlation with impaired diastolic function when compared with other ECG parameters (r = 0.88, R2 = 0.78).
| Parameter | No DD (ms) | With DD (ms) | P | R2 | R |
|---|---|---|---|---|---|
| QT | 343.4±11 | 345±5.5 | 0.53 | 0.04 | 0.06 |
| QTC | 366.8±13.1 | 409.1±25.6 | <0.01 | 0.554 | 0.7 |
| P wave dispersion | 45.2±4.7 | 62.4±5.4 | <0.01 | 0.7 | 0.83 |
| VAT | 35±3.6 | 42.5±3.2 | <0.01 | 0.46 | 0.67 |
| T end P | 395.8±77.6 | 268.5±84.9 | <0.01 | 0.33 | 0.57 |
| T end Q | 519.2±56.4 | 396.00±42 | <0.01 | 0.5 | 0.7 |
| P wave duration | 105.4±12 | 110.2±14 | 0.3 | 0.01 | 0.1 |
| PR | 114.5±16.1 | 119.8±13.1 | 0.6 | 0.02 | 0.1 |
| QRS | 100.8±8.6 | 103.4±10.4 | 0.4 | 0.01 | 0.11 |
QTc: Corrected QT, VAT: Ventricular activation time, DD: Diastolic dysfunction
| No DD (ms) | With DD (ms) | P | R2 | r | |
|---|---|---|---|---|---|
| QT | 388±32.4 | 383.7±26.3 | 0.57 | 0.05 | 0.07 |
| QTc | 372±37.4 | 400.8±28 | 0.03 | 0.14 | 0.38 |
| PWD | 37.3±4.5 | 59.14±8 | <0.01 | 0.77 | 0.87 |
| VAT | 30.85±2.3 | 42.4±6.2 | <0.01 | 0.8 | 0.99 |
| T end P | 386.43±50.1 | 292±61 | <0.01 | 0.4 | 0.4 |
| T end Q | 485±78.5 | 327.7±41.3 | <0.01 | 0.57 | 0.75 |
| P wave duration | 104.2±11.2 | 112±15.2 | 0.2 | 0.01 | 0.1 |
| PR | 114.5±16.1 | 121±12.1 | 0.6 | 0.02 | 0.11 |
| QRS | 100.8±8.6 | 104±11 | 0.4 | 0.01 | 0.12 |
QTc: Corrected QT, PWD: P wave dispersion, DD: Diastolic dysfunction, VAT: Ventricular activation time
ROC curves were analyzed for the sensitivity and specificity of each parameter [Figures 3 and 4]. Among all the ECG parameters used in our study, P wave dispersion at a cutoff value of 50 ms has the highest sensitivity (92%) (area under the curve = 0.88) and T end P-at a cutoff value of 280 ms has the highest specificity (78%) [Table 4].

- Receiver operator characteristics curves of ECG parameters.
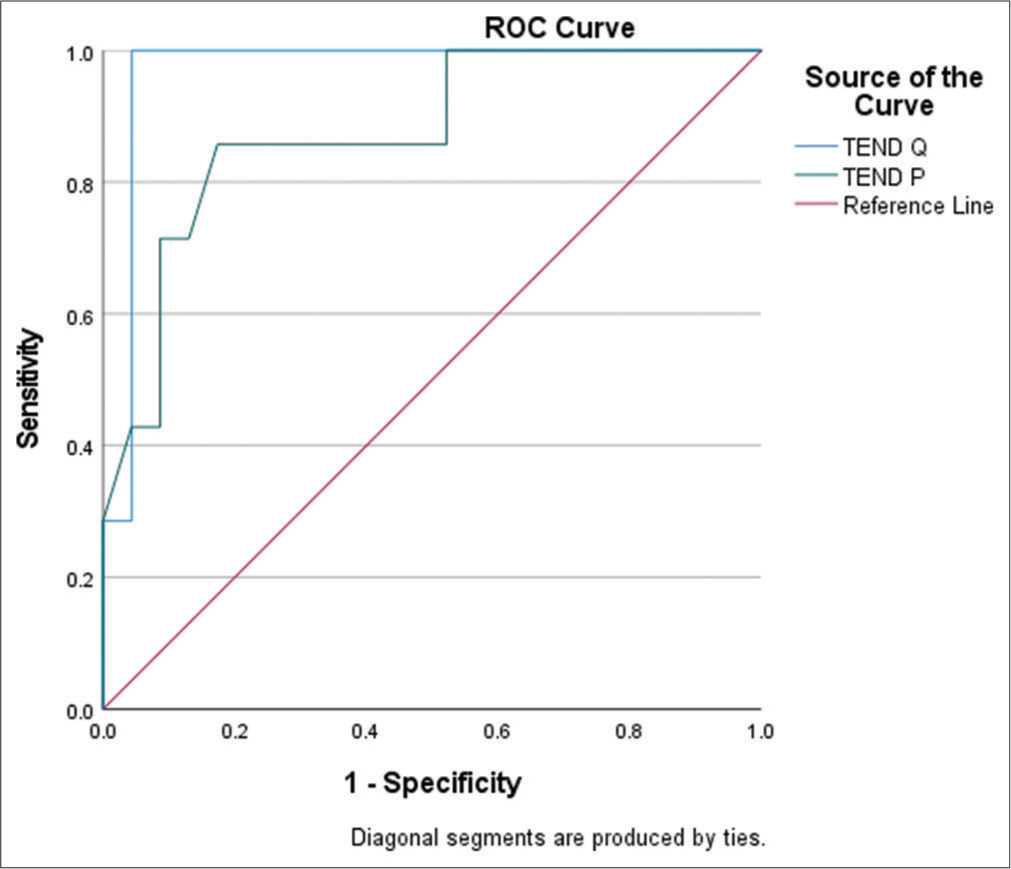
- Receiver operator characteristics curves of T end P and T end Q.
| ECG parameter | AUC | Normal value (ms) | Cut off value (ms) | Sensitivity (%) | Specificity (%) |
|---|---|---|---|---|---|
| P wave dispersion | 0.88 | 20–38 | 50 | 92 | 49 |
| VAT | 0.81 | 35–40 | 42 | 71 | 55 |
| QTc | 0.84 | 350–440 | 390 | 62 | 68 |
| T end P | 0.9 | 310–450 | 280 | 58 | 78 |
| T end Q | 0.87 | 450–600 | 320 | 88 | 59 |
ECG: Electrocardiographic, AUC: Area under the curve, QTc: Corrected QT, VAT: Ventricular activation time
DISCUSSION
Our study aimed at performing a detailed analysis of different ECG indices and their role in predicting DD in men and women with the early hypertension. In this study, we have analyzed the ECG changes associated with impaired diastolic function in the early hypertensive patients which are not well known. Guidelines to detect DD by 2D echo are well-known and widely accepted, but electrical remodeling may happen even before myocardial remodeling.[12] There are no well-established criteria to predict DD using ECG.
In our study, demographical variables did not influence the occurrence of DD apart from age. Our results were in line with the results of a study by Namdar et al.,[13] regarding the relationship between age and the presence or absence of DD, but disagreed with the results of a study by Gunduz et al.[14] who demonstrated no significant differences regarding age between the groups with and without DD.
Dimensions of the left atrium are a marker of the chronicity of DD. P wave dispersion in ECG is a reliable indicator of dimensions of the left atrium, and it is a non-invasive ECG tool to detect remodeling of atria.[15] Evidence from clinical and basic research has strongly demonstrated that the activated renin-angiotensin-aldosterone system (RAAS) has a role in the pathogenesis of DD that is commonly seen in hypertensive patients and postmenopausal women with estrogen deficiency.
Activated RAAS generates reactive oxygen species which promote and amplify the cardiac fibrotic process resulting in reduced conduction velocity. Increased P wave dispersion in ECG reflects a prolonged intra-atrial and inter-atrial conduction time.[16]
In our study, it was found that P wave dispersion had a better correlation with the presence or absence of diastolic function when compared with other ECG parameters. Similar findings were observed in a study by Taha et al.[9]
QTc intervals were longer in patients with DD. Many studies done previously demonstrated a significant correlation between parameters of DD on 2D echo and QTc interval in ECG.[9,17]
In patients with the left ventricular hypertrophy due to electrical remodeling, ventricular activation time may increase even if LV mass remains the same. The findings of our study were similar to a study by Usama Boles suggesting a significant association between VAT and impaired diastolic function.[18]
T end P and T end Q intervals in ECG had a good correlation in predicting DD in our study. Similar results were obtained in a study by Namdar et al.[13]
QT interval, P wave duration, and PR interval in ECG had no statistically significant relation with the presence or absence of DD in the early hypertensive patients in our study.
The results of our study suggest that resting ECG can be used as an easy and reliable bedside tool to predict DD in the early hypertensive patients.
Limitations
All patients in the study were having hypertension and are categorized based on the presence or absence of DD, and there were no normal subjects included in the study.
Most of the subjects in the group with DD in our study had Grade 1 DD on 2D echo when compared with those having Grade 2 and Grade 3 DD.
This study was conducted with a less sample size; further, research is needed in the future with a larger group of patients to confirm the findings of our study.
CONCLUSION
Analysis of certain ECG parameters, especially P wave dispersion, is of great value in predicting DD in both men and women with hypertension.
Declaration of patient consent
Patient’s consent not required as there are no patients in this study.
Financial support and sponsorship
Nil.
Conflicts of interest
There are no conflicts of interest.
References
- Global burden of hypertension: Analysis of worldwide data. Lancet. 2005;365:217-23.
- [CrossRef] [Google Scholar]
- Prevalence of hypertension among Indian adults: Results from the great India blood pressure survey. Indian Heart J. 2019;71:309-13.
- [CrossRef] [PubMed] [Google Scholar]
- Heart failure with preserved ejection fraction: Pathophysiology and emerging therapies. Cardiovasc Ther. 2011;29:e6-21.
- [CrossRef] [PubMed] [Google Scholar]
- Sex differences in cardiovascular pathophysiology why women are overrepresented in heart failure with preserved ejection fraction. Circulation. 2018;138:198-205.
- [CrossRef] [PubMed] [Google Scholar]
- Sex differences in the prevalence of diastolic dysfunction in cardiac surgical patients. J Card Surg. 2015;30:238-45.
- [CrossRef] [PubMed] [Google Scholar]
- Gender differences in the health related quality of life of older adults with heart failure. Heart Lung. 2003;32:320-7.
- [CrossRef] [Google Scholar]
- Gender differences in health-related quality of life in patients with systolic heart failure: Results of the VIDA multicenter study. J Clin Med. 2020;9:2825.
- [CrossRef] [PubMed] [Google Scholar]
- Trends in prevalence and outcome of heart failure with preserved ejection fraction. N Engl J Med. 2006;355:251-9.
- [CrossRef] [PubMed] [Google Scholar]
- How accurate can electrocardiogram predict left ventricular diastolic dysfunction? Egypt Heart J. 2016;68:117-23.
- [CrossRef] [Google Scholar]
- Electrocardiographic arrhythmia risk testing. Curr Probl Cardiol. 2004;29:365-432.
- [CrossRef] [PubMed] [Google Scholar]
- Missing female patients: An observational analysis of sex ratio among outpatients in a referral tertiary care public hospital in India. BMJ Open. 2019;9:e026850.
- [CrossRef] [PubMed] [Google Scholar]
- Prevalence of left ventricular diastolic dysfunction in a general population. Circ Heart Fail. 2009;2:105-12.
- [CrossRef] [PubMed] [Google Scholar]
- A novel electrocardiographic index for the diagnosis of diastolic dysfunction. PLoS One. 2013;8:79-152.
- [CrossRef] [PubMed] [Google Scholar]
- Relation between stage of left ventricular diastolic dysfunction and QT dispersion. Acta Cardiologica. 2003;58:303-8.
- [CrossRef] [PubMed] [Google Scholar]
- Does impaired left ventricular relaxation affect P wave dispersion in patients with hypertension? Ann Noninvasive Electrocardiol. 2003;8:189-93.
- [CrossRef] [PubMed] [Google Scholar]
- P-wave dispersion: An update. Indian Pacing Electrophysiol J. 2016;16:126-33.
- [CrossRef] [PubMed] [Google Scholar]
- Usefulness of electrocardiographic QT interval to predict left ventricular diastolic dysfunction. Am J Cardiol. 2011;108:1760-6.
- [CrossRef] [PubMed] [Google Scholar]
- Ventricular activation time as a marker for diastolic dysfunction in early hypertension. Am J Hypertens. 2010;23:781-5.
- [CrossRef] [PubMed] [Google Scholar]