

Translate this page into:
Objective Evaluation of Psychosocial Stress and Its Association with Cardiovascular Risk in Women
B. Shashi Preetham ESIC Medical College Sanath Nagar, Hyderabad 500038, Telangana India bshashipreetham2000@gmail.com
This article was originally published by Thieme Medical and Scientific Publishers Pvt. Ltd. and was migrated to Scientific Scholar after the change of Publisher.
Abstract
Abstract
Background Psychosocial stress in women is an emerging problem that is by and large unnoticed. Workplaces are being stressful places for women, but the degree of the stress as perceived by them is highly subjective.
Aim To evaluate the stress using the 10-item perceived stress scale (PSS-10) and dividing the participants into low, moderate, and severe stress groups based on the scores. To objectively assess the cardiovascular risk using heart rate variability (HRV) as an index.
Methods After obtaining informed and written consent, a mixed population of 50 women working at various levels in the hospital, and home-makers were included in the study. PSS-10 questionnaires were administered and scores were obtained. Electrocardiogram was obtained from lead II at rest for 10 minutes, and HRV was estimated using the LabChart Pro software (ADInstruments).
Results Of the participants, 72% were in the moderate perceived stress group. Mean PSS scores were 10.33 ± 0.82, 19.72 ± 3.4, and 29.3 ± 2.3 in low, moderate, and high stress groups, respectively. Frequency-domain measures showed very significant difference across the groups. Very low frequency (VLF) was reduced (p = 0.04) and low frequency (LF) was higher (p = 0.01) in the high stress group.
Conclusions Reduced VLF in the high perceived stress group is an indicator of higher cardiovascular mortality risk, which also signifies posttraumatic stress disorder. High LF and reduced high-low frequency powers signify autonomic imbalance in these women. Their perceptions of the stress were also more toward the inability to contain positive emotions when compared with having negative emotions related to stress.
Keywords
HRV
negative emotions
positive emotions
perceived stress
PSS-10
VLF

Introduction
Stress has become a word used very often by many sections in our society. Stress has physiological significance in generating vigilance and drive in the biological systems. Stress remains a strongly subjective phenomenon. A stressor at a given time for a given individual may not be so stressful or not stressful at all at another time. Social, cultural, financial, interperson interactions, workplace demands, aims, goals, and many more factors converge to produce what is termed as a stress state within us. In this scenario of multifactorial causation, exploring the physiological mechanisms in stress is a challenging task. General adaptation syndrome explains that three major factors mould a stress response in an individual. One-the specific actions of a stressor, due to the action on target organs through agonists, antagonists, or a non-specific damage to tissue; two-extraneous conditioning factors such as heredity, diet; three-previous exposure to stress and the kind of adaptive learning happened. These three factors can lead to a variety of polymorph syndromes in different individuals.1 In this background, this study aims at evaluating the psychosocial stress in women through a well-known stress questionnaire and trying to establish a correlation of the perceived stress with an objective parameter, heart rate variability (HRV). The perceived stress scale (PSS) is a classic stress assessment instrument. Originally developed in 1983, this tool remains a popular choice to understand how different situations affect the feelings and our perceived stress.2 The feelings and thoughts about events in the past 1 month are asked, and the participant should indicate how he/she felt or thought a certain way. In the 10-item PSS (PSS-10), items 4, 5, 7, and 8 enquire about the positive side of the feelings or thoughts in contrast to the rest six items that enquire about the negative feelings or states. Few studies conducted in the past showed that even though emotions are basically dichotomous, each emotion may have positivity or negativity imparted to it by the individual’s perception, which will again depend on various other factors such as culture and experiences.3 For instance, item 4 asks “In the last month, how often have you felt confident about your ability to handle your personal problems?” item 5 asks “In the last month, how often have you felt that things were going your way?” item 7 asks “In the last month, how often have you been able to control irritations in your life?” and item 8 asks “In the last month, how often have you felt that you were on top of things?” In contrast, the rest of the questions ask the participants about the negative feelings like “were you outside your control?” “were difficulties piling up?” “how often have you been upset or stressed?” and so on. Hence, perceptions may range from positivity to negativity for a particular item in the questionnaire. Accordingly, items 4, 5, 7, and 8 are given negative scoring, with the maximum attainable score being 16. Such discrimination throws light into a fundamental causation of stress, as appeared to us. We felt that being negative and not being able to be positive are the two main distinctions in the causation of stress. HRV is a well-established index for autonomic balance. Various models designed by researchers like Thayer, Porges, and Taylor described the relation between the prefrontal brain areas controlling the cardiac vagal tone, which is assumed to be the most important indicator of social adaptability and emotional flexibility.4 HRV fundamentally has statistical analysis of the beat-to-beat intervals (RR intervals) from a normal electrocardiogram (ECG). The duration of HRV measurement may be ultrashort (1 minute or less), short (5 minutes), or 24-hour recording.5 The various measures obtained from this ECG record are divided into time-domain measures, frequency-domain measures, and nonlinear measures. Out of the time-domain measures, root mean square of the successive differences (RMSSD) and pNN50 are found to be maximally sensitive to changes in autonomic balance in various studies. Similarly, in the frequency-domain measures, high-frequency (HF) power usually corresponds to parasympathetic or vagal tone of the heart, and low-frequency (LF) power represents a combination of sympathetic and parasympathetic activity. Very LF (VLF) power is an intrinsic cardiac generated rhythm that is subject to modulation by both limbs of the autonomic system.5 Amusement, anger, and fear are found to have affected HRV differently, with amusement having the maximum healthy advantage on the heart.6 Various emotions have been found to affect the power spectrum measures of HRV from which the concepts of high-frequency (HF) power being a better indicator of health sprouted.7 Later studies have shown that not only the production of emotion but also the regulation of emotion through cognitive efforts was also found to affect the HRV. Trait worry, a negative emotional state perceived by a person due to the trait(s) they carry, and the amount of regulation required to control the emotions of the affective components of their traits have been elucidated clearly.8 Not only the regulation of emotions but also the emotional flexibility in response to positive stimuli is known to affect the HRV measures.9 Autonomic nervous system is modulated during reactions to positive and negative moods, and while these reactions are in action, the frontal electrocorticogram was shown to be changing, as reported by a few authors later on. The shift in the HRV studies toward finding the neural correlates later began.10 Resting-state HRV was associated with the neural tissue changes, and these changes have been compared between explicit and implicit emotional regulations.11 Amygdala was found as a central point in a network that could transmit the cognitive processes through the autonomic pathways to the heart and be responsible for producing HRV.12 The caudate nucleus, medial prefrontal areas, and periaqueductal gray matter are few of the areas found to be involved.13 “Central autonomic network is the term given to the network of such areas in the brain and brain stem, which are now established to be modulating the HRV. The fundamental process through which they modify the HRV is the cardiac vagal tone. The balance between the sympathetic and parasympathetic limbs of the autonomic system on the heart is what determines the functionality of the heart in any state. This is kept under control by the higher areas such that flexibility and adaptability to various emotional, survival, and behavioral demands are encountered. Posttraumatic stress disorder (PTSD) leads to changes in certain brain areas, yet there is another set of areas activated during a phase called called posttraumatic growth.14
The research in the field of HRV and emotion is flourishing in many dimensions, but still the fundamental questions on the subjective perception of stress and the multifactorial causation of stress in humans keep posing challenges to the researchers.
Materials and Methods
The study received permission from its Institutional Ethical Committee. Informed written consent was taken from each participant before the study. The study sample consisted of 50 females in the age group of 25 to 50 years, with a mean age of 36.2 ± 7 years. Of them, 15 were educated up to high school and the rest 35 completed or above their graduation. They all belonged to various socioeconomic backgrounds; 48 women were married and stay with families, whereas 2 were not married. Out of 50 women, 7 were postmenopausal, with the mean duration after menopause being 6.43 ± 3.4 years. None of them were using hormone replacement therapy. Exclusion criteria used in the study are as follows: (1) women diagnosed with psychiatric conditions such as mood disorders, attention disorders, schizophrenia, bipolar disorder, and PTSD whether in the past or at present, (2) women using active psychotropic drugs for any of the psychiatric illnesses, (3) women using other medication such as corticosteroids, oral contraceptive pills, nonsteroidal anti-inflammatory drugs, and antibiotics, (4) women with a known history of hypertension, diabetes mellitus, or any other chronic inflammatory disease such as osteoarthritis and systemic lupus erythematosus, (5) women having tobacco chewing, cigarette smoking, or alcoholism as addictions, (6) women who underwent recent surgeries within 3 to 5 weeks, and (7) women complaining of menstrual abnormalities such as dysmenorrhea and dysfunctional uterine bleeding. Inclusion criteria employed in the study are as follows: (1) women voluntarily willing to participate in the study, (2) women with known stressful situations in the workplace or family, (3) women with atheistic or theistic beliefs, and (4) women of both conservative and socially active traits. Our study group consisted of women participants from all sections in the hospital as well as outside, including doctors, administrative staff, housekeeping staff, supervisors, clerks, employees, self-employed women, and home-makers. A standard time for recording was fixed between 4 and 5 p.m. for all participants when they were relatively free from working hours. They were requested to come to the digital physiology laboratory. After signing the informed consent, they were given a PSS questionnaire designed by the Employee Assistance Program, State of New Hampshire. The PSS consisted of 10 questions. Responses for each question were five, ranging from “never” to “very often” on a scale of 0 to 4. For few women who could not understand a certain question, it was explained verbally. Depending on the scores, the participants were divided into three groups according to the low (scores 0–13), moderate (scores 14–26), and high (scores 27–40) perceived stress groups, which were later analyzed. After they filled the questionnaire, they were made to relax supine on a couch. They were asked to remove any bangles, metal rings, or ornaments worn on fingers and anklets. Skin was cleaned with a 70% isopropyl alcohol skin cleansing swab. Nuprep skin gel was applied over the entire electrode site with a gauze pad, and the skin was rubbed gently. After the skin preparation, the ECG electrodes were connected in lead II, negative electrode connected to the right wrist, positive electrode to the left foot, and ground electrode on the right foot. Electrode gel supplied by Rsons Medikits was applied for better conductance. The participant was placed on a couch with her head facing away from the recording computer. The lead wires were connected to the BioAmp terminal of the PowerLab 15T supplied by ADInstruments. ECG was recorded using LabChart Pro v8.1.9 software for approximately 10 minutes in each participant. At the end of the recording, the electrodes were removed, skin was cleaned with cotton, and the participants were sent. The HRV software in the LabChart pro is calculated after eliminating the ectopic beats. Various time-domain, frequency–domain, and non-linear measures are calculated, of which only a few measures are obtained for this study.
Observations and Results
The filled-in PSS questionnaires were analyzed using standard method. Reversal of the scores for questions 4, 5, 7, and 8 was done, and the total score was obtained for each individual during analysis. The mean score of the group was 18.8 ± 5.62. Among them, 4 participants had severe perceived stress (mean score: 29.3 ± 2.3), 36 participants had moderate stress (mean PSS score: 19.73 ± 3.3), and 10 participants had low stress (mean score: 10.33 ± 0.82). The difference in the mean scores between the groups was very significant at p < 0.0001 (Tables 1 2). As the questions 4, 5, 7, and 8 are considered for negative scoring, the scores only for these four questions were separately calculated, and the percentage contribution of this score to their maximum attainable score was calculated to see if there is any significant variation (Tables 1 2).
|
Group |
Total PSS score |
Score of items 4, 5, 7, and 8 (max score = 16) |
% of the score of items 4, 5, 7, and 8 of their max score |
|---|---|---|---|
|
Abbreviations: HRVs, heart rate variability; PSS, perceived stress scale; SD, standard deviation. |
|||
|
Low perceived stress (n = 10) |
10.33 ± 0.82 |
4.44 ± 1.17 |
27.28 ± 7.28 |
|
Moderate perceived stress (n = 36) |
19.73 ± 3.33 |
6.57 ± 2.77 |
30.38 ± 23.35 |
|
High perceived stress (n = 4) |
29.25 ± 2.28 |
8.25 ± 1.48 |
51.56 ± 9.24 |
|
No. |
HRV measure/parameter |
Low vs. moderate stress, p |
Moderate vs. high stress, p |
Low vs. high stress, p |
|---|---|---|---|---|
|
Abbreviations: HF, high frequency; HR, heart rate; HRV, heart rate variability; LF, low frequency; pRR50, percentage of the RR50 count on a given time series; PSS, perceived stress scale; RMSSD, root mean square of the successive differences; SDRR, standard deviation of the NN (R-R) intervals; VLF, very low frequency. |
||||
|
1 |
Total PSS score |
<0.0001 |
0.0009 |
<0.0001 |
|
2 |
Score of items 4, 5, 7, and 8 |
0.0005 |
0.0560 |
0.0050 |
|
3 |
Average HR (bpm) |
0.3738 |
0.2214 |
0.1870 |
|
4 |
pRR50 (%) |
0.4258 |
0.3347 |
0.3078 |
|
5 |
RMSSD (ms) |
0.1889 |
0.4849 |
0.2818 |
|
6 |
SDRR (ms) |
0.0559 |
0.2968 |
0.2859 |
|
7 |
HF% |
0.1157 |
0.0133 |
0.1930 |
|
8 |
LF% |
0.4425 |
0.0231 |
0.0155 |
|
9 |
VLF% |
0.1472 |
0.0945 |
0.0428 |
|
10 |
LF/HF |
0.4264 |
0.1362 |
0.1438 |
Analysis of the scores separately for items 4, 5, 7, and 8 showed some interesting findings. The maximum score that could be obtained from these four questions was 16. When the obtained score is expressed as a percentage of maximum attainable score, the score of these 4 questions was approximately 51.56% in severe stress group followed by 30.38% in moderate stress group and 27.28% in low stress group (Table 1). This difference in the mean scores for these four questions was quite significant between low and moderate stress groups (p = 0.0005) (Table 2). The time-domain measures considered in the present study were average heart rate (HR), pRR50 (percentage of the RR50 count on a given time series), RMSSD, and SDRR (standard deviation of the NN [R-R] intervals). The mean values of all these variables are calculated, and significance was tested using Student’s unpaired t-test. It was found that for all the time-domain measures, even though statistically a significant differences were not observed, the group with high perceived stress deviated from the other two groups. Average HR and pRR50 were higher in the high stress group (Table 3). The distribution of the maximum (max) and minimum (min) values of each of the time-domain measures across the three groups with low, moderate, and high perceived stress is presented as a bar graph (Fig. 1).
|
Group |
Average heart rate (bpm) |
pRR50 (%) |
RMSSD (ms) |
SDRR (ms) |
|---|---|---|---|---|
|
Abbreviations: HRV, heart rate variability; pRR50, percentage of the RR50 count on a given time series; PSS, perceived stress scale; RMSSD, root mean square of the successive differences; SD, standard deviation; SDRR, standard deviation of the NN (R-R) intervals. |
||||
|
Low perceived stress (n = 10) |
84.41 ± 6.16 |
10.89 ± 20.52 |
25.51 ± 16.63 |
30.49 ± 7.50 |
|
Moderate perceived stress (n = 36) |
85.12 ± 5.6 |
12.26 ± 18.4 |
31.05 ± 18.5 |
36.19 ± 15.3 |
|
Severe perceived stress (n = 4) |
89 ± 8.6 |
16.3 ± 16 |
31.4 ± 15.9 |
32.2 ± 12.8 |

-
Fig. 1 Comparison of max and min values of various time-domain measures of HRV in the low, moderate, and high perceived stress groups. HR, heart rate; HRV, heart rate variability; pRR50, percentage of the RR50 count on a given time series; RMSSD, root mean square of the successive differences; SDRR, standard deviation of the NN (R-R) intervals.
Fig. 1 Comparison of max and min values of various time-domain measures of HRV in the low, moderate, and high perceived stress groups. HR, heart rate; HRV, heart rate variability; pRR50, percentage of the RR50 count on a given time series; RMSSD, root mean square of the successive differences; SDRR, standard deviation of the NN (R-R) intervals.
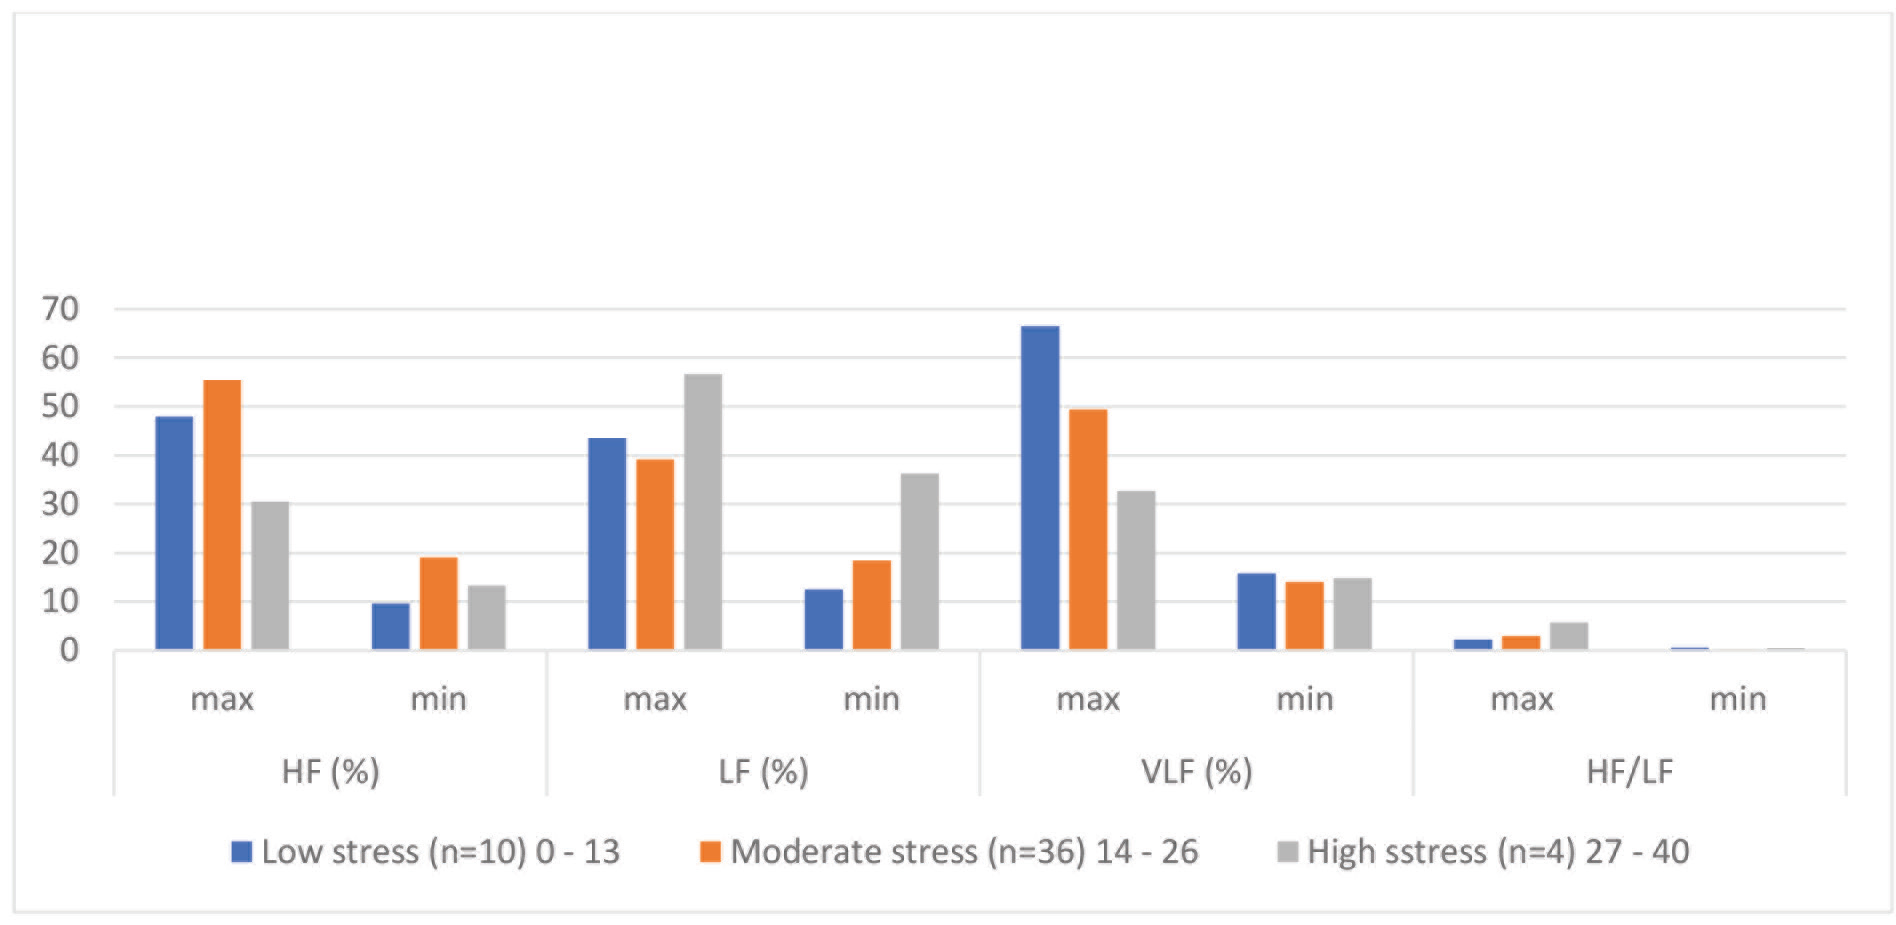
The frequency-domain measures of HRV calculated in this study were the relative power (%) of VLF, LF, HF, and LF/HF ratio. The mean values of all these variables are calculated, and significance was tested using Student’s unpaired t-test. HF, LF, and VLF showed significant difference between the three groups, except LF/HF ratio (Table 2). This ratio is higher in the high stress group from the other two groups, but the significance was not observed statistically. Lower HF and VLF and higher LF power suggest a more stressed state in the third group (Table 4). The distribution of the maximum (max) and minimum (min) values of each of the frequency-domain measures across the three groups with low, moderate, and high perceived stress is presented as a bar graph (Fig. 2). The clear difference between the HF, LF, and VLF powers can be noticed.
|
Group |
VLF power (%) |
LF power (%) |
HF power (%) |
LF/HF (%) |
|---|---|---|---|---|
|
Abbreviations: HF, high frequency; HRV, heart rate variability; LF, low frequency; VLF, very low frequency; SD, standard deviation. |
||||
|
Low perceived stress (n = 10) |
41.12 ± 25.37 |
28.02 ± 15.50 |
28.78 ± 19.14 |
1.39 ± 0.83 |
|
Moderate perceived stress (n = 36) |
31.71 ± 17.7 |
28.79 ± 10.4 |
37.28 ± 18.2 |
1.32 ± 1.6 |
|
Severe perceived stress (n = 4) |
23.8 ± 8.9 |
46.5 ± 10.2 |
21.9 ± 8.6 |
3.1 ± 2.6 |
-
Fig. 2 Comparison of max and min values of various frequency-domain measures of HRV in the low, moderate, and high perceived stress groups. HF, high frequency; HRV, heart rate variability; LF, low frequency; VLF, very low frequency.
Fig. 2 Comparison of max and min values of various frequency-domain measures of HRV in the low, moderate, and high perceived stress groups. HF, high frequency; HRV, heart rate variability; LF, low frequency; VLF, very low frequency.
Discussion
To assess the stress objectively is a challenging task. Various environmental factors such as family, workplace, financial, social, and personal factors converge to produce a stressful situation in us. Of the participants, 72% were with moderately stress, 20% with low perceived stress, and 8% with high perceived stress. They belonged to various work definitions in the institute, including housekeeping staff, managerial staff, administrative staff, faculty, doctors, and residents. When the responses to items 4, 5, 7, and 8 from the PSS-10 were observed separately, it was found that the total score of these four questions alone was high in severe (8.25 ± 1.48) stress group followed by moderate (6.57 ± 2.77) and low (4.44 ± 1.17) stress groups, which is quite significant (Table 2). The aforementioned four items enquire about the positive emotions in the participant, such as “how often have you felt confident about your abilities?” “able to control the irritations in life?” “you were on top of things.” The rest of the six questions in the questionnaire are framed to enquire negative emotions such as upset, stressed, unable to, could not cope with, difficulties, and anger. If we suppose that the perceived stress arises grossly from two kinds of perceptions of the participant: (1) bearing negative feelings or thoughts like “I am nervous or stressed,” “I cannot handle this issue,” and “I was angry because things were not under my control” and (2) not being able to be positive to situations in life, for example, “I could not feel confident about my abilities”; we observe that the contribution of the “not being able to be positive” kind of emotional processes is greater in the high perceived stress group. This is closer to the observations put forth by a few authors that reappraisal and response modulation are the two important processes that operate in the brain and modify the HRV.11
Average HR is higher in the high stress group, which reflects sympathetic activation. The differences in the frequency-domain measures were very significant across the three groups. The VLF band power percentage decreased significantly from low to high stress groups (Table 4). The VLF rhythm is fundamental to health. It has been shown to be associated with arrhythmic death and PTSD.5 Low power in this band is strongly associated with inflammatory processes. The intrinsic heart’s activity, which produces the VLF band, is modified by the sympathetic system through stress response. The less power in VLF band in the high stress group of women supports this concept. The LF band power % is also significantly greater in the high stress group (Tables 2 3 4). In stressful states, or during cognitive reappraisal of negative emotions, the activation of the sympathetic system or vagus will lead to increased LF power. LF is produced by the vagus at lower respiratory rates, the sympathetic system in stress responses, and by baroreceptor reflexes at rest.5 The HF band is quite significantly decreased in the high stress group compared with the moderate stress group (Tables 2 3 4). Lower HF power is correlated with stress, panic, anxiety, or worry. Defective vagal inhibition on heart signifies cardiovascular morbidity.5
Conclusion
The results presented in this study therefore imply that the high perceived stress according to PSS-10 in women is associated with significant changes in frequency-domain measures in HRV compared with time-domain measures. Also, the contribution by the “not being able to be positive” feelings or thoughts is more in the high stress group compared with the other groups.
Conflict of Interest
None.
References
- Employee Assistance Program, State of New Hampshire. Perceived Stress Scale. Available at: https://das.nh.gov/wellness/docs/percieved%20stress%20scale.pdf. Accessed November 20, 2019
- Two sides of emotion: exploring positivity and negativity in six basic emotions across cultures. Front Psychol. 2017;8(610):1-14.
- [Google Scholar]
- Heart rate variability and cardiac vagal tone in psychophysiological research - recommendations for experiment planning, data analysis, and data reporting. Front Psychol. 2017;8(213):213.
- [Google Scholar]
- An overview of heart rate variability metrics and norms. Front Public Health. 2017;5(258):1-17.
- [Google Scholar]
- Neural correlates of heart rate variability during emotion. Neuroimage. 2009;44(01):213-222.
- [Google Scholar]
- Structural covariance of the prefrontal-amygdala pathways associated with heart rate variability. Front Hum Neurosci. 2018;12:02.
- [Google Scholar]
- Resting state vagally-mediated heart rate variability is associated with neural activity during explicit emotion regulation. Front Neurosci. 2018;12(794):794.
- [Google Scholar]
- How do amusement, anger and fear influence heart rate and heart rate variability? Front Neurosci. 2019;13:1131. (1131)
- [Google Scholar]
- Heart rate variability predicts emotional flexibility in response to positive stimuli. Psychology (Irvine). 2012;3(08):578-582.
- [Google Scholar]
- Autonomic nervous system reactivity to positive and negative mood induction: the role of acute psychological responses and frontal electrocortical activity. Biol Psychol. 2011;86(03):230-238.
- [Google Scholar]
- The impact of trait worry and emotion regulation on heart rate variability. Cogent Psychol. 2015;2:1038896.
- [Google Scholar]
- The effects of emotions on short-term power spectrum analysis of heart rate variability. Am J Cardiol. 1995;76(14):1089-1093.
- [Google Scholar]
- Affective emotion increases heart rate variability and activates left dorsolateral prefrontal cortex in post-traumatic growth. Sci Rep. 2017;7(01):16667.
- [Google Scholar]