

Translate this page into:
Epicardial Fat Tissue Thickness as a Cardiovascular Risk Marker and its Association with Microalbuminuria in Patients with Essential Hypertension
*Corresponding author: C. A. Ajeya Kashyap, Department of Cardiology, Nizam Institute of Medical Sciences, Hyderabad, Telangana, India. ajeyakashyapca@gmail.com
-
Received: ,
Accepted: ,
How to cite this article: Kashyap CA, Harish H. Epicardial fat tissue thickness as a cardiovascular risk marker and its association with microalbuminuria in patients with essential hypertension. Indian J Cardiovasc Dis Women 2023;8:110-5.
Abstract
Objectives:
Hypertension is one of the essential modifiable risk factors in causing stroke, renal disease, cardiovascular diseases, and peripheral artery disease. Epicardial fat tissue is regarded as endocrine organ and is metabolically active as it produces angiotensinogen and free fatty acids which are proinflammatory cytokines and are atherogenic. The presence of microalbuminuria has been associated with endothelial dysfunction that predisposes to cardiovascular events. The aim of this study is to determine the association of epicardial fat tissue with age, sex, serum creatinine, left ventricular (LV) mass, serum albumin, low-density lipoprotein (LDL), and triglycerides in patients with essential hypertension.
Materials and Methods:
One hundred patients with essential hypertension were divided into two groups each having 50 patients. Group A included urinary albumin creatinine ratio (UACR) <30 mg/g. Group B included UACR >30 mg/g. Age, body mass index, blood pressure, creatinine, urea, albumin, LDL, triglycerides, and epicardial adipose tissue thickness (EAT) were evaluated and compared between two groups. All patients underwent UACR, transthoracic echocardiography to determine EAT, LV mass, and ejection fraction.
Results:
In our study, EAT ranged from 2 mm to 6.9 mm, with mean value of 3.21 mm and 5.12 mm in Groups A and B, respectively. Mean EAT values were found to be higher in Group B compared to A and was found to be statistically significant. Similarly, LDL, triglycerides, serum albumin levels, and LV mass showed significant difference among two groups. Serum albumin level in Group B was significantly reduced than the patients with normal urine albumin creatinine ratio.
Conclusion:
EAT serve as an important indicator in patients with essential hypertension to determine target organ damage and to stratify high risk group.
Keywords
Hypertension
Microalbuminuria
Epicardial fat tissue thickness
Cardiovascular risk
Left ventricular mass

ABSTRACT IMAGE

INTRODUCTION
Hypertension is one of the essential modifiable risk factor in causing stroke, renal disease, cardiovascular diseases, and peripheral artery disease.[1] Diagnosis of hypertension in quiescent stage will help in prevention of development of cardiovascular diseases. Few newer diagnostic indicators have emerged in diagnosis of high risk hypertensive individuals. Epicardial adipose tissue and microalbuminuria are few markers for early diagnosis of end organ damage in patients with essential hypertension.
Epicardial fat tissue is regarded as endocrine organ and is metabolically active as it produces angiotensinogen and free fatty acids which are pro-inflammatory cytokines and are atherogenic.[2] This is associated with metabolic syndrome, insulin resistance, coronary artery disease, and atherosclerosis.
Microalbuminuria is important risk factor in development of cardiac diseases. It is proven to be early marker for determining cardiac damage and kidney damage in patients of hypertension. The presence of microalbuminuria has been associated with endothelial dysfunction that predisposes to cardiovascular events. This is proven in patients having essential hypertension.[3] Hence, in the study, we aim to measure epicardial adipose tissue thickness (EAT) in patients having hypertension without microalbuminuria and patients having microalbuminuria and determine if there is any association of EAT in hypertension patients with microalbuminuria.[4] By this, we can determine if epicardial fat tissue thickness measurement can be independently taken as marker of cardiovascular diseases.[5]
Aims and objectives
The aim of the study was to determine the association of epicardial fat tissue thickness with age, sex, serum creatinine, left ventricular (LV) mass, serum albumin, low-density lipoprotein (LDL), triglycerides in patients with essential hypertension with microalbuminuria and without albuminuria.
MATERIALS AND METHODS
We carried out study in NIMS hospital from June 2022 to October 2022. Patients coming to Cardiology and General medicine OPD were taken for the study. Total of 100 patients who satisfied the inclusion and exclusion criteria were taken for study. The study was approved by NIMS Ethical Committee. Informed written consent was taken from patients.
In the study, we have included patients aged more than 18 years and with primary hypertension who are newly diagnosed or known case on medications. Patients with chronic kidney disease, diabetes mellitus (or fasting blood glucose >125 mg/dL), coronary heart disease, secondary causes of hypertension, valvular defects, heart failure, previous stroke, neoplasia, inflammatory, hepatic or kidney disease (including a history of proteinuria, hematuria, serum creatinine >1.3 mg/dL in men and 1.2 mg/dL in women and positive urine culture), febrile condition, anemia, and patients on statins were excluded from the study.
The blood pressure (BP) of the patient was measured twice by principal investigator. Participants were advised to rest for 15 min. Patients are advised to avoid coffee, tea, alcohol, cigarettes, and exercise for at least 30 min before BP measurement. Digital sphygmomanometer was used for BP measurement, and one of two cuff sizes was used based on the circumference of the participant’s arm.
All the echocardiography (ECHO) examinations were performed by cardiac ECHO with 2.5–3.5 MHz probe. Patients examined in the left lateral position by M-mode,2 D Echo and Doppler ECHO. Ventricular measurements such as LV internal diameter, septal thickness, and thickness of posterior wall were measured in end diastole. Devereux formula was used to calculate LV mass. From the parasternal long-axis view, EAT was measured in parasternal long axis view along the right ventricular free wall. Epicardial adipose tissue is identified as echo-free space in the pericardial layers on the 2-D echo and its thickness is measured perpendicularly on the right ventricle at end-diastole for three cardiac cycles. EAT can be measured in both end systole or end diastolic period. End systolic measurement will give higher values compared to end diastole. For standardization of measurements and publications, EAT is measured during end diastolic period.
The study subject urine samples collected at the first urine void in the morning for calculating UACR. Urinary albumin is estimated using immunoturbidimetric method and urinary creatinine is estimated by automated enzymatic assay. Urinary albumin excretion is calculated as the urinary albumin creatinine ratio (UACR). Microalbuminuria is defined when urine albumin/creatinine ratio is 30–300 g/mg.
All patients participating in the study underwent renal function assessment, fasting lipid profile, and albumin levels. Patient’s blood samples were collected in sterile condition in fasting state and creatinine, urea, lipid profile, and albumin levels were determined using spectrophotometric method.
All patients were divided into two groups. Each group had 50 patients. Group A patients had no microalbuminuria. Group B patients had albumin level in urine between 30 and 300 g/mg. Both the groups were subjected to 2D ECHO examination. Epicardial fat tissue thickness, LV mass, and LV wall thickness were determined and analyzed.
Statistical analysis
For statistical analysis, we used Statistical Package for the Social Sciences for windows version 22.0. All continuous variables were summarized using mean and standard deviation. Pearson’s Chi-square test was applied for the comparison of categorical variables, and the means of normally distributed continuous variables is compared by Student’s t-test. Correlation is tested with Spearman’s analysis. All data were analyzed at the end of the study and P < 0.05 is considered as statistically significant. Multivariate analysis was done with ANOVA and linear regression analysis.
RESULTS
The study subjects were made into two groups on the basis of urine albumin creatinine ratio. Patients with urine albumin creatinine ratio <30 mg/g were considered under group A. Patients with UACR between 30 and 300 mg/g were considered under Group B. The baseline characteristic of study population is depicted in [Tables 1 and 2]. A total of 100 patients were taken for study. Each group had 50 patients. There was significant difference in age, diastolic BP, lipid profile, serum albumin, epicardial fat tissue thickness, and LV mass between two groups in our study.
| Group A (UACR <30) n=50 |
Group B (UACR 30–300) n=50 |
P-value (t-test) | |
|---|---|---|---|
| Age (years) | 46.92±13.5 | 52.90±10.393 | 0.015 |
| BMI (kg/sq.m) | 22.96±1.812 | 22.87±1.508 | 0.797 |
| SBP (mm of Hg) | 134.08±11.154 | 138.76±13.419 | 0.61 |
| DBP (mm of Hg) | 84.28±5.785 | 87.84±5.404 | 0.002 |
| Duration of hypertension (years) | 3.62±1.783 | 5.14±3.245 | 0.005 |
UACR: Urine albumin creatinine ratio, BMI: Body mass index, SBP: Systolic blood pressure, DBP: Diastolic blood pressure
| Group A (UACR <30) n=50 |
Group B (UACR 30–300) n=50 |
P-value (t-test) | |
|---|---|---|---|
| Serum creatinine (mg/dL) |
0.83±0.252 | 0.88±0.250 | 0.339 |
| Blood urea (mg/dL) |
24.88±7.668 | 28.30±8.389 | 0.794 |
| LDL (mg/dL) | 87.20±10.443 | 95.14±9.706 | <0.001 |
| Serum Triglyceride (mg/dl) |
132.02±11.931 | 149.18±13.882 | <0.001 |
| Serum Albumin (g/L) | 3.89±0.335 | 3.63±0.237 | <0.001 |
| EAT (in mm) | 3.21±0.575 | 5.12±0.967 | <0.001 |
| LV Mass (g) | 105.72±13.836 | 155.98±14.727 | <0.001 |
| LV EF% | 57.78±3.835 | 56.86±4.314 | 0.262 |
UACR: Urine albumin creatinine ratio, LDL: low density lipoproteins, EAT: Epicardial adipose tissue thickness, LV: Left ventricular, LV EF: Left ventricular ejection fraction
[Table 3] shows distribution of both male and female patients in both the groups. The EAT thickness was studied in both the groups, it was found to have insignificant correlation between males and females (P = 0.68). EAT ranged from 2 mm to 6.9 mm, with mean value of 3.21 mm and 5.12 mm in Groups A and B, respectively. Mean EAT in patients with UACR <30 were 3.21 ± 0.575 mm while in patients with UACR between 30 and 300 were 5.12 ± 0.967 mm. Mean EAT values is higher in Group B compared to A and was found to be statistically significant [Figure 1].
| Sex | Group | Total | |
|---|---|---|---|
| Group A | Group B | ||
| Male | 32 | 30 | 62 |
| Female | 18 | 20 | 38 |
| Total | 50 | 50 | 100 |

- Mean epicardial adipose tissue thickness.
Similarly, LDL, triglycerides, serum albumin levels, and LV mass showed significant difference among two groups. Serum albumin level in Group B was significantly reduced than the patients with normal urine albumin creatinine ratio [Figure 2]. Similarly, mean LV mass was more in patients having microalbuminuria compared to Group A patients [Figure 3]. Serum triglyceride level was also found to be increased in Group B and was statistically significant [Figure 4]. Serum LDL level mean value in Group A is 87.20 ± 10.443, while in Group B is 95.14 ± 9.706 mg/dL [Figure 5].

- Means of Serum albumin.

- Means of left ventricular mass.

- Means of triglycerides in Group A and B.
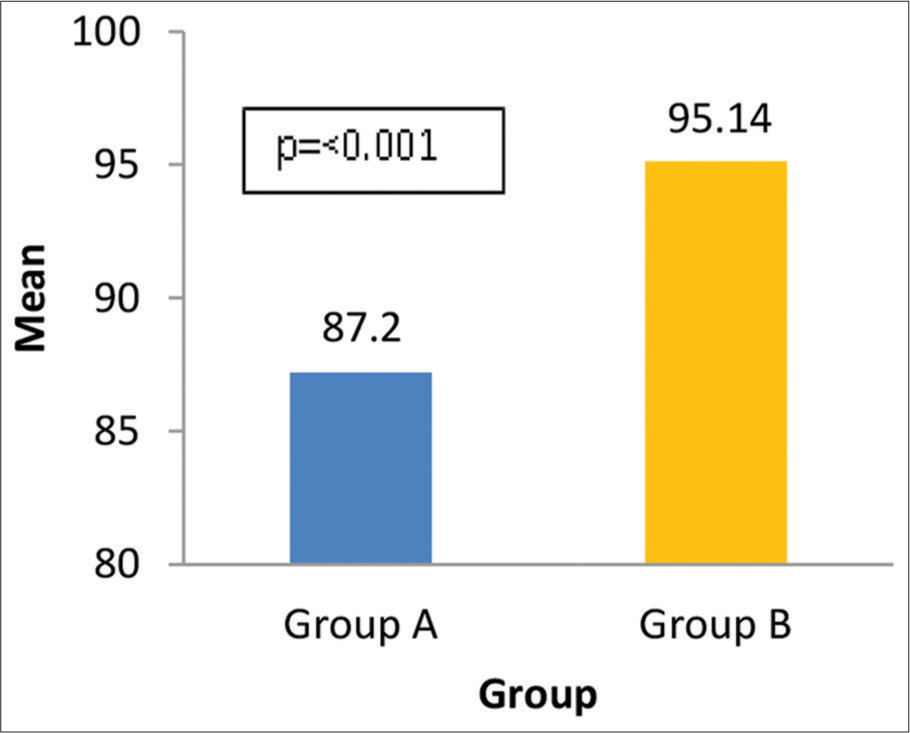
- Means of low-density lipoprotein.
Correlation between age, serum creatinine, serum albumin, LV mass, and LV ejection fraction (EF) with EAT was done. In our study, we were able to demonstrate positive correlation between LV mass and EAT (R = +0.644). As the LV mass increased, EAT also increased. EAT was also found to be positively correlating with respect to age (r = 0.265), LDL (r = 0.288, P < 0.001), triglycerides (r = 0.442, P < 0.001), and negatively correlated with respect to serum albumin levels (r = −0.298, P < 0.001) [Figure 6].

- Correlation analysis between EAT and different variables. (a and b) show positive correlation between EAT with age and LV mass, respectively. (c) Negative correlation between EAT and EF. EAT: Epicardial adipose tissue thickness, LV: Left ventricular, EF: Ejection fraction.
[Table 4] shows linear regression analysis of data obtained in our study. The analysis is done between epicardial adipose tissue with age, albumin level, LDL, triglyceride, LV mass, systolic BP, and diastolic BP. A very significant association was seen with respect to LV mass and EAT thickness association. Negative association was observed with serum albumin, which suggested that increase in EAT thickness is associated with decrease in albumin levels in patients with microalbuminuria.
| Model | Unstandardized coefficients | Standardized coefficients | t | Sig. | 95.0% Confidence interval for B | |||
|---|---|---|---|---|---|---|---|---|
| B | Std. Error | Beta | Lower bound | Upper bound | ||||
| 1 | (Constant) | −1.244 | 2.204 | −0.564 | 0.574 | −5.621 | 3.133 | |
| Age (Years) | 0.010 | 0.008 | 0.104 | 1.320 | 0.190 | −0.005 | 0.026 | |
| Serum Albumin | −0.294 | 0.318 | −0.075 | −0.924 | 0.358 | −0.926 | 0.338 | |
| LV Mass | 0.021 | 0.004 | 0.498 | 5.314 | 0.000 | 0.013 | 0.029 | |
| LDL | −0.003 | 0.011 | −0.027 | −0.290 | 0.772 | −0.025 | 0.018 | |
| Triglycerides | 0.015 | 0.008 | 0.186 | 1.875 | 0.064 | −0.001 | 0.031 | |
| SBP | −0.001 | 0.010 | −0.011 | −0.109 | 0.913 | −0.022 | 0.020 | |
| DBP | 0.018 | 0.023 | 0.084 | 0.780 | 0.437 | −0.028 | 0.063 | |
LV: Left ventricular, LDL: Low density lipoproteins, EAT: Epicardial adipose tissue thickness, SBP: Systolic blood pressure, DBP: Diastolic blood pressure
DISCUSSION
We conducted the study to see the correlation of EAT thickness and microalbuminuria in patients having hypertension. In our study, statistically significant association between EAT and microalbuminuria was seen in patients with essential hypertension. In Framingham heart study conducted in 2011, visceral and subcutaneous adipose tissues both were associated with microalbuminuria.[6]
Iacobellis et al. study showed LV mass correlated with amount of Epicardial fat.[7] Our study also showed positive and significant correlation with respect to EAT. There is increase in LV mass with increase in EAT in patients with microalbuminuria.
Mookadam et al. study showed that EAT of more than 5 mm was associated with significant LV mass.[8] It is also associated with decreased EF with respect to EAT of more than 5mm. Our study also holds in concordance with this. Patients with microalbuminuria had mean EAT value of 5.12 mm. Moreover, the study subjects in this group had significantly high LV mass compared to patients without microalbuminuria.
Murai et al. showed that BP correlated with urine albumin level. Increased albumin excretion is associated with age, body mass index, lipid profile, and LV mass.[9] These findings were in concordance with our study.
de Beus et al. showed that in hypertensive patients having high vascular risk, increased LV mass is associated with albuminuria.[10] Liu et al. study found that LV systolic function was lower in patients having albuminuria with decrease in EF.[11] In our study, mean LV systolic EF was lower in patients with patients having microalbuminuria.
CONCLUSION
In our study, we were able to conclude that there is significant correlation between EAT and microalbuminuria in patients with essential hypertension. It was found that EAT was significantly elevated in hypertensive patients having microalbuminuria and also patients having increase in LV mass. It is strong marker of high cardiovascular risk. With this, high cardiovascular risk patients can be stratified with measurement of EAT which can be determined by 2D ECHO.
Limitation
The present study is done in limited subjects. Larger population analysis is required for confirming the results. EAT thickness is calculated using 2D ECHO, which can be done by magnetic resonance imaging or computed tomography for more accurate data. For generalization of result, larger study group analysis is required.
Declaration of patient consent
The authors certify that they have obtained all appropriate patient consent.
Conflicts of interest
There are no conflicts of interest.
Audio summary available at
Financial support and sponsorship
Nil.
References
- Deaths by Cause, Age, Sex, by Country and by Religion, 2000-2016. 2018. Geneva: World Health Organization; Available from: https://www.origin.who.int/healthinfo/globalburdendisease/estimates/en [Last accessed on 2018 Mar 15]
- [Google Scholar]
- Epicardial adipose tissue: Far more than a fat depot. Cardiovasc Diag Ther. 2014;4:416-29.
- [Google Scholar]
- Relation between epicardial adipose tissue thickness and blood pressure levels in prehypertension. Turk Kardiyol Dern Ars. 2014;42:358-64.
- [CrossRef] [PubMed] [Google Scholar]
- Epicardial adipose tissue is independently associated with increased left ventricular mass in untreated hypertensive patients: An observational study. Anadulu Kardiyol Derg. 2013;13:320-7.
- [CrossRef] [Google Scholar]
- Epicardial adipose tissue accumulation is associated with renal dysfunction and coronary plaque morphology on multidetector computed tomography. Circ J. 2016;80:196-201.
- [CrossRef] [PubMed] [Google Scholar]
- Association of subcutaneous and visceral adiposity with albuminuria: The Framingham Heart Study. Obesity (Silver Spring). 2011;19:1284-9.
- [CrossRef] [PubMed] [Google Scholar]
- Relation between epicardial adipose tissue and left ventricular mass. Am J Cardiol. 2004;94:1084-7.
- [CrossRef] [PubMed] [Google Scholar]
- Epicardial fat and its association with cardiovascular risk: A cross sectional observational study. Heart Views. 2010;11L:103-8.
- [CrossRef] [PubMed] [Google Scholar]
- The prevalence, characteristics, and clinical significance of abnormal albuminuria in patients with hypertension. Sci Rep. 2014;4:3884.
- [CrossRef] [PubMed] [Google Scholar]
- Presence of albuminuria predicts left ventricular mass in patients with chronic systemic arterial hypertension. Eur J Clin Invest. 2015;45:550-6.
- [CrossRef] [PubMed] [Google Scholar]
- Association of albuminuria with systolic and diastolic left ventricular dysfunction in Type 2 diabetes: The strong heart study. J Am Coll Cardiol. 2003;41:2022-8.
- [CrossRef] [PubMed] [Google Scholar]