

Translate this page into:
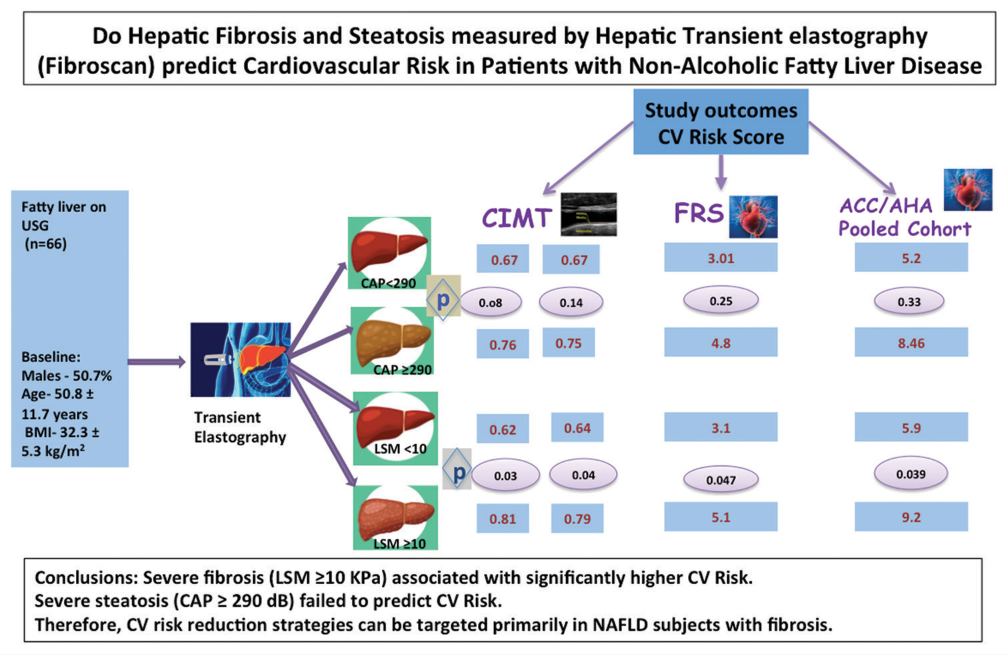
Do Hepatic Fibrosis and Steatosis Measured by Hepatic Transient Elastography (FibroScan) Predict Cardiovascular Risk in Patients with Non-alcoholic Fatty Liver Disease: An Observational Cross-sectional Study
*Corresponding author: Prerna Goyal, Department of Medicine, RG Stone and Super Specialty Hospital, Ludhiana, Punjab, India. drprerna156@gmail.com
-
Received: ,
Accepted: ,
How to cite this article: Goyal P, Chopra R, Goyal O. Do Hepatic Fibrosis and Steatosis Measured by Hepatic Transient Elastography (FibroScan) Predict Cardiovascular Risk in Patients with Non-alcoholic Fatty Liver Disease: An Observational Cross-se ctional Study. Indian J Cardiovasc Dis Women. 2024;9:66-73. doi: 10.25259/IJCDW_2_2024
Abstract
Objectives:
Non-alcoholic fatty liver disease (NAFLD) has been associated with increased cardiovascular risk (CVR) in the previous studies. In the majority, ultrasonography has been used to diagnose and stage NAFLD, which lacks sensitivity and is non-quantitative. Other more sensitive, comprehensive, and quantitative diagnostic tools such as vibration-controlled transient elastography (TE) have largely been underused in research work. TE-driven liver stiffness measurement (LSM) and controlled attenuation parameter (CAP) provide an accurate and simplified estimation of liver fibrosis and steatosis, respectively. Therefore, we aimed to analyze the association between these two objective, robust parameters and CVR.
Materials and Methods:
In this observational cross-sectional study, NAFLD participants were divided into two distinct categories of steatosis (CAP <290 and ≥290 dB) and fibrosis (LSM <10 and ≥10 kPa). Their CVR assessment was done by calculating Framingham risk score (FRS), American College of Cardiology/American Heart Association Pooled Cohort Equation Score (ACC/AHA PCES), and carotid intimal medial thickness (CIMT).
Results:
A greater number of participants presented with mild-moderate fibrosis (n = 41, 62.1%) as compared to severe fibrosis (n = 25, 37.8%) whereas severe steatosis participants predominated (n = 52, 78%) as compared to mild-moderate steatosis. The presence of significant fibrosis (LSM ≥10 kPa) was independently and significantly associated with FRS, ACC/AHA PCES, and CIMT. On the other hand, the presence of significant steatosis (CAP ≥290 dB/m) was not significantly associated with any CVR marker (FRS, ACC/AHA PCES, or CIMT), though a greater number of participants with CIMT >0.7 belonged to severe steatosis group.
Conclusion:
Subjects with severe fibrosis (LSM ≥10) had a significantly higher CVR, whereas severe steatosis (CAP ≥290) alone failed to predict CVR. Therefore, CVR reduction strategies can be targeted primarily in NAFLD subjects with fibrosis, particularly in resource-limited healthcare settings.
Keywords
Non-alcoholic fatty liver disease
Liver fibrosis
Fatty liver
Cardiovascular risk
Liver steatosis

ABSTRACT IMAGE
INTRODUCTION
Cardiovascular disease (CVD) remains the leading cause of death worldwide, accounting for approximately 18 million deaths per year. The worldwide prevalence of metabolic diseases, such as type 2 diabetes mellitus, obesity, and non-alcoholic fatty liver disease (NAFLD), also known to be common risk factors for CVD, has dramatically increased over the past decades. At present, NAFLD has become one of the major diseases plaguing the world and affecting >25% of adults worldwide, with varying prevalence depending on the race and ethnicity.[1]
As per the recent survey report (2016–2018), the highest prevalence (33%) of NAFLD has been found in South Asian countries.[2] Several Indian studies have reported a 17–32% incidence of NAFLD in urban Indian populations based on ultrasound (US).[3] Although NAFLD is the leading cause of chronic liver disease, the predominant cause of mortality in NAFLD patients remains CVD. Recent research publications have confirmed the association of NAFLD with cardiovascular risk (CVR), especially the more advanced stages of NAFLD in the form of non-alcoholic steatohepatitis (NASH) and cirrhosis and have suggested to focus on the identification of NAFLD as a preventive tool in cardiology. Furthermore, the American Heart Association in its latest scientific statement considered NAFLD as an atherosclerotic CVD risk enhancer.[4] Thus, it becomes more relevant to diagnose NAFLD in the initial stages, especially in South Asians and Indians, in whom the prior demographic data confirm the earlier onset of CVD as compared to Western counterparts.[5]
In most of the studies assessing NAFLD as a CVR predictor, hepatic steatosis has been measured by hepatic US, which lacks sensitivity, is non-quantitative, subjective, and unreliable for detecting fibrosis.[6] Other more sensitive noninvasive diagnostic options such as vibration-controlled transient elastography (TE) and magnetic resonance elastography are available which can provide a more comprehensive and quantitative estimation of the severity of liver disease but have largely been underused even in research work. Liver stiffness measurement (LSM, which reflects fibrosis) and controlled attenuation parameter (CAP, which reflects steatosis) are two distinct, more accurate parameters derived from hepatic TE, which can simplify the estimation of liver fibrosis and steatosis, short of liver biopsy, in patients with NAFLD. These two promising and feasible markers have scarcely been studied in relation to CV complications and mortality in individuals with NAFLD.
There have been conflicting results from previous trials focusing on TE parameters as CVR predictors; therefore, we intended to analyze the association between these two objective, more robust parameters in relation to carotid intimal medial thickness (CIMT), Framingham risk score (FRS), and American College of Cardiology/American Heart Association Pooled Cohort Equation Score (ACC/AHA PCES) in adults with no prior history of CVD in a cross-sectional cohort of individuals with NAFLD. We have included two different clinically relevant CVR calculators as a part of the assessment – FRS and AHA/ACA-PCES. For our population, we do not have any validated tools till now. In a study on young Indian patients, FRS has been found to be the most useful CVR predictor model, better than ACC/AHA-PCES, and the 3rd iteration of Joint British Societies risk calculators (JBS3).[7] FRS has also been found to be the most useful predictor tool in a study on 1110 Indian patients by Garg et al.[8] Whereas in another study, ACC/AHA-PCE followed by FRS and JBS3 were found to be the most accurate and acceptable tools for CVR assessment in 1000 Indian patients.[9] Thus, these two reliable tools were shortlisted for CVR estimation. Moreover, both the tools are easy to use in clinical practice. The FRS considers seven coronary risk factors, including age, gender, total cholesterol (TC), high-density lipoprotein cholesterol (HDL), smoking habits, systolic blood pressure (BP), and BP being treated with medicines. CIMT is an important surrogate marker of subclinical atherosclerosis, measured by B (brightness)-mode ultrasonography and best visible in the measurement segment of the distal common carotid artery with the lowest measurement variability.
To the best of our knowledge, this is the first Indian study in which we have attempted to explore CVR in relation to TE driven stages of liver fibrosis and steatosis.
Aims and objectives
Primary
The objective of this study was to study the relationship between hepatic fibrosis (LSM) and established CVR markers (CIMT, FRS, and ACC/AHA PCES).
Secondary
The objective of this study was to study the relationship between hepatic steatosis (CAP) and established CVR markers (CIMT, FRS, and ACC/AHA PCES).
MATERIALS AND METHODS
Study population
In this observational, cross-sectional, and descriptive study, we enrolled adults, aged 30–80 years, diagnosed to have fatty liver on routine hepatic US, for a period of 3 months, from May 2023 to July 2023. Patients with excessive alcohol consumption (daily alcohol intake >20 g in women and >30 g in men), viral B and C hepatitis , human immunodeficiency virus (HIV) infection, Wilson’s disease, alpha-antitrypsin deficiency, autoimmune hepatitis, genetic hemochromatosis, those consuming steatosis-inducing drugs, those with decompensated cirrhosis or hepatocellular carcinoma, as well as patients with prior history of bariatric surgery, were excluded from the study. Patients with a history of coronary heart disease/myocardial infarction/congestive heart failure, presence of free abdominal fluid, cancer, terminal illness, and pregnant women were also excluded from the study.
The study protocol got approval from the regional Research Ethics Committee. Written informed consents were obtained from all participants.
Sample size
The sample size for correlation was generated using power analysis and sample size software version 11.0. The null hypothesis was taken as zero (R0), which means that there is no correlation between NAFLD and CVR, and the alternative hypothesis as 0.46 (R1 0.4) based on the previous population studies, which suggests a moderate correlation between NAFLD and CVR. Using a two-sided test, a 5% significance level test (α = 0.05) with power 80% (β = 0.20), the required sample size was calculated to be at least 46 (n = 46).
Anthropometric, clinical, and laboratory assessments
After taking signed informed consent, a complete clinical, anthropometric, and laboratory assessments were done along with CIMT estimation and TE in all individuals found to have hepatic steatosis on routine US. History of diabetes, BP, smoking, and premature CV events in family members were recorded. Patients were classified as normal weight, overweight, and obese according to their corresponding body mass index (BMI) values of <23, 23–25, and ≥25 kg/m2. Waist circumference values >80 cm (women) and >94 cm (men) were taken to define the presence of abdominal obesity. Hypertension was defined by BP ≥140/90 mmHg or use of any antihypertensive drugs, whereas dyslipidemia was defined by low-density lipoprotein (LDL)-cholesterol >100 mg/dL, triglycerides >150 mg/dL, and/or high density lipoprotein (HDL) cholesterol <40 mg/dL for men and 50 mg/dL for women, or use of lipid-lowering drugs.
Concurrent therapy was enquired, including the use of any hypoglycemic, antihypertensives, and lipid-lowering drugs.
A complete biochemical panel including glucose, creatinine, bilirubin, aspartate aminotransferase, alanine aminotransferase, alkaline phosphatase, albumin, and lipid profile was conducted in all patients. FRS and ACC/AHA PCES were calculated for all study participants.
Hepatic Steatosis and Fibrosis Assessment by TE
Estimation of hepatic steatosis and fibrosis severity scoring was done by hepatic TE (FibroScan) using the medium (M) probe or the extra large (XL) probe (in case of unsuccessful measurement).
Steatosis (S) and Fibrosis (F) were graded as S1 (mild), S2 (moderate), S3 (severe) and F1 (mild), F2 (moderate), F3 (severe), and F4 (very severe), respectively, as per the following defined cutoff levels [Table 1].
| Steatosis (S) | S1 | S2 | S3 | |
|---|---|---|---|---|
| value (dB/m) | 238–259 | 260–289 | 290–400 | |
| Fibrosis (F) | F1 | F2 | F3 | F4 |
| value (kPa) | 2–7.4 | 7.5–9.9 | 10–13.9 | ≥14 |
CAP: Controlled attenuation parameter, LSM: Liver stiffness measurement, S1, S2, S3: Stand for stages of steatosis, F1 to F4: Stand for stages of fibrosis
CVR assessment (FRS, ACC/AHA PCES, and CIMT)
FRS was calculated for all patients, and categorized as low (<10%), intermediate (10–19%), and high (≥20%). Similarly, ACC/AHA PCES (incorporates all FRS parameters along with the history of diabetes and ethnicity) was calculated for all and categorized as low-borderline (<5–7.5%), intermediate (7.5–20%), and high (≥20%). CIMT of both sides was determined. CIMT cutoff of more than 0.7 mm was taken to define high CVR.
Statistical analysis
Data obtained were entered into the computer using Microsoft Excel programs and relevant statistical tests were done along with the generation of tables using the Statistical Package for the Social Sciences version 20 software. Continuous variables were expressed as means ± standard deviation or medians (range values), and categorical variables as absolute and relative frequencies (n, %). The Chi-squared test or the Fisher exact test (for categorical variables), the unpaired Student’s t-test, and the Mann–Whitney test (for normally and not normally distributed continuous variables) were used to compare differences between the groups.
We also performed binary multivariable logistic regression analyses to test the association of different grades of CAP and liver fibrosis with CIMT, FRS, and ACC/AHA PCES after adjusting for established cardiometabolic risk factors and variables found to be statistically significant at univariable regression analyses. A two-tailed P ≤ 0.05 was considered to be statistically significant.
RESULTS
Basal population characteristics
Of the 152 volunteers, 66 (43.4%) met the inclusion criteria and were enrolled in the study. Out of them, 34 (50.7%) were men and 32 (47.8%) were women. The mean age was 50.8 ± 11.7 years, BMI 32.3 ± 5.3 kg/m2, and waist circumference 101.74 ± 16.5 cm. A total of 27 (40.9%) were diabetics and 17 (25.7%) were hypertensives. The mean baseline values of various biochemical parameters in study participants are shown in Table 2.
| Variable | Mean±Standard deviation | Minimum | Maximum |
|---|---|---|---|
| Age (years) | 50.8±11.7 | 32 | 79 |
| Weight (kg) | 78.59±14.9 | 42 | 130 |
| BMI (kg/m2) | 32.3±5.3 | 15.9 | 50.8 |
| Waist circumference (cm) | 101.7±16.5 | 70 | 182 |
| Total cholesterol (mg/dL) | 190.21±40.5 | 103 | 296 |
| Triglycerides (mg/dL) | 170.64±63.4 | 49 | 312 |
| HDL (mg/dL) | 47.29±14.0 | 34 | 142 |
| LDL (mg/dL) | 102.88±39.5 | 30 | 204 |
| VLDL (mg/dL) | 40.74±55.1 | 2 | 372 |
| AST (IU/mL) | 36.02±30.3 | 12 | 167 |
| ALT (IU/mL) | 47.31±48.1 | 11 | 285 |
| LSM (kPa) | 9.64±3.2 | 4 | 19 |
| CAP (dB/m) | 317.3±60.4 | 8 | 450 |
| Right CIMT (mm) | 0.74±0.3 | 0 | 1 |
| Left CIMT (mm) | 0.86±0.2 | 0 | 1 |
| FRS | 4.44±5.2 | 0.0 | 23.0 |
| ACC/AHA PCES | 7.34±11.3 | 0 | 65 |
Data are represented as mean±standard deviation. FRS: Framingham risk score, ACC/AHA PCES: American College of Cardiology/American Heart Association pooled cohort equation score, ALT: Alanine transaminase, AST: Aspartate transaminase, BMI: Body mass index, CAP: Controlled attenuation parameter, CIMT: Carotid intimal medial thickness, HDL: High-density lipoprotein, LDL: Low-density lipoprotein, VLDL: Very low-density lipoprotein, LSM: Liver stiffness measurement, FRS: Framingham risk score
Estimated scores of liver steatosis (CAP) and fibrosis (LSM) by TE
For the purpose of CVR correlation and comparison, the whole study group was divided into two distinct steatosis groups – S1 + S2 (CAP <289 dB/m) and S3 (CAP ≥290 dB/m). Similarly, fibrosis study groups were made – F1 + F2 (LSM 2–9.9 kPa) and F3 + F4 (≥10 kPa). Tables 3 and 4 show the distribution of patients in the above-mentioned two distinct categories.
| Variable | CAP <290 dB/m, n=14 | CAP ≥290 dB/m n=52 | P-value |
|---|---|---|---|
| Age (years) | 48.71±9.17 | 51.15±11.62 | 0.47 |
| Weight (kg) | 68.85±11.24 | 81.21±14.56 | 0.004 |
| Male | 5 (35.7%) | 29 (55.7%) | 0.81 |
| BMI (kg/m2) | 26.22±3.81 | 30.09±5.49 | 0.16 |
| Waist circumference (cm) | 92.28±12.78 | 101.71±17.04 | 0.05 |
| Comorbidities | |||
| Diabetes | 6 (53.1%) | 21 (40.3%) | 1.0 |
| Hypertension | 4 (28.5%) | 13 (25%) | 0.74 |
| Investigations | |||
| Lipid profile (mg/dL) | |||
| Total cholesterol | 187.07±44.69 | 191.05±38.84 | 0.74 |
| Triglycerides | 172.12±61.1 | 210.12±68.9 | 0.034 |
| HDL | 48.13±15.43 | 44.15±4.75 | 0.34 |
| LDL | 103.57±43.83 | 103.36±37.54 | 0.98 |
| VLDL | 24.089±10.70 | 45.36±6.58 | <0.0001 |
| AST (IU/mL) | 33.68±28.65 | 44.37±33.40 | 0.23 |
| ALT (IU/mL) | 44.21±39.77 | 58.50±68.29 | 0.31 |
| CIMT (mm) | |||
| Right | 0.67±0.13 | 0.76±0.18 | 0.08 |
| Left | 0.67±0.14 | 0.75±0.19 | 0.14 |
| Framingham’s score | 3.01±4.18 | 4.8±5.35 | 0.25 |
| ACC/AHA PCES | 5.21±7.14 | 8.46±11.96 | 0.33 |
| CIMT >0.7 | 4 (28.5%) | 32 (61.5%) | 0.037 |
Data are represented as mean±standard deviation, or number (percent). FRS: Framingham risk score, ACC/AHA PCES: American college of cardiology/American heart association pooled cohort equation score, ALT: Alanine transaminase, AST: Aspartate transaminase, BMI: Body mass index, CAP: Controlled attenuation parameter, CIMT: Carotid intimal medial thickness, HDL: High-density lipoprotein, LDL: Low-density lipoprotein, LSM: Liver stiffness measurement, VLDL: Very low-density lipoprotein, significant p values (<0.05) are marked in bold, CVR: cardiovascular risk
| Variables | LSM <10 kPa n=41 | LSM ≥10 kPa n=25 | P-value |
|---|---|---|---|
| Age (years) | 49.43±10.58 | 52.6±11.86 | 0.26 |
| Weight (kg) | 73.49±12.46 | 81.0±14.51 | 0.02 |
| Male | 23 (56%) | 11 (44%) | 0.34 |
| BMI (kg/m2) | 27.48±4.0 | 32.20±60.09 | 0.61 |
| Waist circumference (cm) | 95.08±11.65 | 107.88±20.06 | 0.007 |
| Comorbidities | |||
| Diabetes | 16 (39.1%) | 11 (44%) | 0.443 |
| Hypertension | 10 (24.4%) | 7 (28%) | 0.481 |
| Investigations | |||
| Lipid profile (mg/dL) | |||
| Total cholesterol | 185.68±37.71 | 192.14±41.60 | 0.81 |
| Triglycerides | 177.47±46.91 | 202.92±55.76 | 0.04 |
| HDL | 47.83±15.89 | 46.4±10.0 | 0.68 |
| LDL | 101.51±37.24 | 106.24±41.05 | 0.63 |
| VLDL | 29.48±14.02 | 58.25±82.41 | 0.03 |
| AST (IU/mL) | 33.417±22.86 | 40.08±38.39 | 0.37 |
| ALT (IU/mL) | 45.28±45.55 | 50.56±50.91 | 0.66 |
| CIMT (mm) | |||
| Right | 0.62±0.17 | 0.81±0.17 | 0.03 |
| Left | 0.64±0.17 | 0.79±0.20 | 0.04 |
| Framingham’s risk score | 3.1±3.21 | 5.1±4.12 | 0.047 |
| ACC/AHA PCES | 5.9±6.32 | 9.7±8.6 | 0.039 |
| CAP (>290 dB/m) | 28 (68.2%) | 24 (96%) | 0.011 |
| CIMT>0.7 | 17 (41.4%) | 19 (76%) | 0.01 |
Data are represented as mean±standard deviation, or number (percent). ACC/AHA PCES: American college of cardiology/American heart association pooled cohort equation score, ALT: Alanine transaminase, AST: Aspartate transaminase, BMI: Body mass index, CAP: Controlled attenuation parameter, CIMT: Carotid intimal medial thickness, HDL: High-density lipoprotein, LDL: Low-density lipoprotein, LSM: Liver stiffness measurement, VLDL: Very low-density lipoprotein
Mean CAP reported in overall study population was 317 ± 60.4. CAP <290 dB/m was noted in 14 (21.2%) and CAP ≥290 dB/m in 52 (78%) of study participants, which means that we had predominance of participants with severe stenosis. The mean values of body weight, abdominal circumference, triglycerides, and VLDL were significantly higher in the severe steatosis group.
On the contrary, greater number of participants presented with mild-moderate fibrosis as compared to severe fibrosis; 41 (62.1%) with LSM <10 versus 25 (37.8%) with LSM ≥10. Mean LSM was 9.9 ± 3.1. About 96% of participants with severe fibrosis also had severe steatosis. The mean values of body weight, abdominal circumference, triglycerides, and VLDL were also significantly higher in the severe fibrosis group. No other demographic and biochemical parameters differed between both the groups.
Estimated CVR scores (FRS, ACC/AHA PCES, and CIMT)
According to FRS, 56 (84.8%), 9 (13.6%), and 1 (1.5%) of patients were found at have low, intermediate, and high CVR, respectively. The corresponding figures were 44 (66.6%), 12 (18.1%), and 9 (13.6%) as per ACC/AHA PCES [Figure 1].

- Distribution of patients in different risk categories of Framingham risk score and American college of cardiology (ACC)/American heart association pooled cohort equation score (AHA PCES). (FRS, Framingham Risk Score; ACC/AHA PCES, American college of cardiology/American heart association pooled cohort equation score).
Mean CIMT was found to be 0.74 on the right side and 0.86 on the left side. CIMT ≥0.7 mm was reported in 36 (54.5%) participants and 30 (45.4%) had CIMT <0.7 mm. Age, abdominal circumference, diabetics, and blood cholesterol were statistically significantly higher in participants with CIMT ≥0.7. Higher CIMT correlated well with greater FRS and ACC/AHA PCES supporting CIMT as a surrogate marker of subclinical atherosclerosis [Table 5].
| Variable (mean±standard deviation) | CIMT <0.7 n=30 | CIMT ≥0.7 n=36 | P-value |
|---|---|---|---|
| Age (years) | 43.23±7.6 | 56.80±9.8 | <0.0001 |
| Weight (kg) | 75.46±13.2 | 81.19±15.6 | 0.11 |
| Male | 12 (40%) | 22 (61.1%) | 0.63 |
| BMI (kg/m2) | 28.18±4.87 | 30.18±5.68 | 0.13 |
| Waist circumference (cm) | 94.68±13.35 | 104.30±17.72 | 0.017 |
| Comorbidities | |||
| Diabetes | 8 (26.7%) | 19 (52.8%) | 0.045 |
| Hypertension | 5 (16.7%) | 12 (33.3%) | 0.78 |
| Investigations | |||
| Lipid profile (mg/dL) | |||
| Total cholesterol | 179.16±35.85 | 199.41±41.28 | 0.03 |
| Triglycerides | 166.91±69.77 | 173.75±56.40 | 0.66 |
| HDL | 47.08±9.37 | 47.46±16.87 | 0.98 |
| LDL | 98.86±35.93 | 107.27±40.83 | 0.38 |
| VLDL | 28.85±12.76 | 50.72±71.54 | 0.47 |
| AST (IU/mL) | 30.97±27.12 | 42.51±32.36 | 0.95 |
| ALT (IU/mL) | 38.36±39.51 | 58.42±54.31 | 0.62 |
| Framingham’s score | 1.83±2.62 | 6.61±5.75 | 0.02 |
| ACC/AHA PCES | 2.3±4.01 | 12.25±13.07 | 0.02 |
ACC/AHA PCES: American college of cardiology/American heart association pooled cohort equation score, SD: Standard deviation, CVR: Cardiovascular risk, CIMT: Carotid intimal medial thickness, HDL: High-density lipoprotein, LDL: Low-density lipoprotein, VLDL: Very low-density lipoprotein, ALT: Alanine transaminase, AST: Aspartate transaminase, BMI: Body mass index
Correlation between liver fibrosis (LSM) and CVR
In logistic regression analysis, the presence of significant fibrosis (LSM ≥10 kPa) was independently and significantly associated with FRS, ACC/AHA PCES, and CIMT. Furthermore, a statistically significant number of participants with high CIMT were present in the severe fibrosis group.
Correlation between liver steatosis (CAP) and CVR
In logistic regression analysis, the presence of significant steatosis (CAP ≥290 dB/m) was independently and significantly associated with serum triglyceride levels, but not with any CVR marker (FRS, ACC/AHA PCES or CIMT). However, a greater number of participants with CIMT >0.7 belonged to severe steatosis group (P = 0.037).
DISCUSSION
Given the multifaceted pathophysiology of CVDs, identifying and focusing on the high-risk groups can assist the health-care professionals in preventing and delaying the onset of CVDs. One such high-risk group includes NAFLD, which has currently been given the status as one of the hepatic element of metabolic syndrome, with its extreme subtypes; NASH and hepatic fibrosis being associated with poor prognosis and high CVR.[10]
There has been a plethora of studies on NAFLD and CVR association based on US and biochemical profile. Only few observational studies are available that explored CVD risk association with CAP and LSM dependent different stages of NAFLD, majority of which have been done in diabetics with variable results. In an observational study by Cardoso et al., advanced liver fibrosis has been found to be a risk marker whereas severe steatosis was found to protective factor for cardiovascular complications and mortality.[11] CAP was not associated with any macro/microvascular complications, whereas LSM ≥7.0/6.2 kPa was independently associated with prior CVD, presence of microvascular complications, chronic kidney disease, and retinopathy.[12] Similarly, in another study, significant liver fibrosis, not steatosis was found to be associated with an increased likelihood of any macro-/microvascular diabetic complications.[13] Whereas, in another study, both elastographic parameters of liver steatosis and fibrosis independently predicted the long-term risk of developing chronic vascular complications in type 2 diabetes mellitus patients.[14]
Our study also reported a strong CVR association with TE derived severe fibrosis (LSM >10 Kpa) but not with severe steatosis. This is in accordance to a large analysis by Kim et al. on 11,154 participants from the United States National Health and Nutrition Examination Survey (1988–1994) who reported higher CV mortality in severe fibrosis group but not steatosis.[15] A meta-analysis of 16 studies including 34,043 adults also concluded that odds ratio of developing CVD events increased from 1.64 in NAFLD to 2.58 with presence of severe fibrosis or cirrhosis.[16] Data on Indian population correlating the association of hepatic steatosis and fibrosis with CVR are scarce and this study strives to delve into this evolving and novel subject.
While navigating through all above-mentioned research papers, it becomes evident that fibrosis alone stands as one such common NAFLD parameter that can predict CVR with high degree of accuracy. The notion also gets stronger if we closely analyze the position paper of the Indian National Association for the Study of the Liver, Indian College of Cardiology, Endocrine Society of India, and Indian Society of Gastroenterology, which do not recommend routine CV screening in all patients with NAFLD except elderly, or having metabolic risk factors and NASH-related cirrhosis or hepatocellular carcinoma.[17] Although hepatic transaminases and ultrasonography-based grading can provide a rough estimate of severity of fatty liver disease, TE-guided determination of liver fibrosis undoubtedly performs more precisely and can serve as a potential tool in the hands of preventive cardiologists for CVR assessment. Understanding whether the liver disease in NAFLD contributes to additional CVR is important, as it is plausible that treatment of the liver disease may reduce the overall CVR above the treatment of NAFLD-associated risk factors.[18,19]
Our study has few limitations. First, our study included patients from a single medical center, so findings may not be a good representation of the general population. Second, the study was cross-sectional; therefore, we cannot confirm the causality. Further prospective studies are necessitated to overcome these limitations.
Potential clinical implications
FibroScan, an underutilized diagnostic modality, provides an accurate assessment of liver fibrosis and steatosis, which is not possible by routine ultrasonography. Beyond the identification of liver fibrosis/steatosis, severe fibrosis derived by FibroScan may allow the prediction of patients at increased risk of CVD, independently of other established cardiometabolic risk factors. Thus, in primary care, a more reliable and accurate methodology for estimation of severity of fibrosis in the form of FibroScan should be aimed. In the light of evolving trials and research publications, it is expected that in near future some NAFLD parameters, particularly higher grades of fibrosis may become a key component of the comprehensive evaluation of CVR estimation and may provide a window of opportunity to healthcare professionals and policy makers for early intervention and CV prevention.
CONCLUSION
In our study, subjects with severe fibrosis (LSM ≥10) had a significantly higher CVR, whereas severe steatosis (CAP ≥ 290) alone failed to predict CVR. Therefore, CV risk reduction strategies can be targeted primarily in NAFLD subjects with fibrosis, particularly in resource limited healthcare settings.
Ethical approval
The research/study approved by the Institutional Review Board at Mohadai Oswal Cancer Treatment and Research Foundation, number EC/CT/01/23, dated June 13, 2023.
Declaration of patient consent
The authors certify that they have obtained all appropriate patient consent.
Conflicts of interest
Dr. Prerna Goyal is on the editorial board of the Journal.
Use of artificial intelligence (AI)-assisted technology for manuscript preparation
The authors confirm that there was no use of artificial intelligence (AI)-assisted technology for assisting in the writing or editing of the manuscript and no images were manipulated using AI.
Audio summary available at:
Financial support and sponsorship
Nil.
References
- Global Epidemiology of Nonalcoholic Fatty Liver Disease: Meta-Analytic Assessment of Prevalence, Incidence, and Outcomes. Hepatology. 2016;64:73-84.
- [CrossRef] [PubMed] [Google Scholar]
- Global Burden of NAFLD and NASH: Trends, Predictions, Risk Factors and Prevention. Nat Rev Gastroenterol Hepatol. 2018;15:11-20.
- [CrossRef] [PubMed] [Google Scholar]
- Prevalence of Non-Alcoholic Fatty Liver Disease in Urban South Indians in Relation to Different Grades of Glucose Intolerance and Metabolic Syndrome. Diabetes Res Clin Pract. 2009;84:84-91.
- [CrossRef] [PubMed] [Google Scholar]
- Nonalcoholic Fatty Liver Disease and Cardiovascular Risk: A Scientific Statement from the American Heart Association. Arterioscler Thromb Vasc Biol. 2022;42:e168-85.
- [CrossRef] [Google Scholar]
- Effect of Potentially Modifiable Risk Factors Associated with Myocardial Infarction in 52 Countries (the INTERHEART study): Case-Control Study. Lancet. 2004;364:937-52.
- [CrossRef] [PubMed] [Google Scholar]
- Current Status of Imaging in Nonalcoholic Fatty Liver Disease. World J Hepatol. 2018;10:530-42.
- [CrossRef] [PubMed] [Google Scholar]
- Clinical Comparison of Different Cardiovascular Risk Scores for Cardiovascular Risk Prediction in Indian Patients. Int J Res Med Sci. 2019;7:2770-4.
- [CrossRef] [Google Scholar]
- Comparison of Different Cardiovascular Risk Score Calculators for Cardiovascular Risk Prediction and Guideline Recommended Statin Uses. Indian Heart J. 2017;69:458-63.
- [CrossRef] [PubMed] [Google Scholar]
- A Cross-sectional Validation Study Comparing the Accuracy of Different Risk Scores in Assessing the Risk of Acute Coronary Syndrome among Patients in a Tertiary Care Hospital in Kerala. Indian Heart J. 2020;72:113-8.
- [CrossRef] [PubMed] [Google Scholar]
- Modeling NAFLD Disease Burden in China, France, Germany, Italy, Japan, Spain, United Kingdom, and United States for the Period 2016-2030. J Hepatol. 2018;69:896-904.
- [CrossRef] [PubMed] [Google Scholar]
- Prognostic Impact of Liver Fibrosis and Steatosis by Transient Elastography for Cardiovascular and Mortality Outcomes in Individuals with Nonalcoholic Fatty Liver Disease and Type 2 Diabetes: The Rio de Janeiro Cohort Study. Cardiovasc Diabetol. 2021;20:193.
- [CrossRef] [PubMed] [Google Scholar]
- Liver Fibrosis by FibroScan® Independently of Established Cardiovascular Risk Parameters Associates with Macrovascular and Microvascular Complications in Patients with Type 2 Diabetes. Liver Int. 2020;40:347-54.
- [CrossRef] [PubMed] [Google Scholar]
- Significant Liver Fibrosis, as Assessed by Fibroscan, is Independently Associated with Chronic Vascular Complications of Type 2 Diabetes: A Multicenter Study. Diabetes Res Clin Pract. 2021;177:108884.
- [CrossRef] [PubMed] [Google Scholar]
- Elastographic Parameters of Liver Steatosis and Fibrosis Predict Independently the Risk of Incident Chronic Kidney Disease and Acute Myocardial Infarction in Patients with Type 2 Diabetes Mellitus. J Diabetes Complications. 2022;36:108226.
- [CrossRef] [PubMed] [Google Scholar]
- Association between Noninvasive Fibrosis Markers and Mortality among Adults with Nonalcoholic Fatty Liver Disease in the United States. Hepatology. 2013;57:1357-65.
- [CrossRef] [PubMed] [Google Scholar]
- Non-alcoholic Fatty Liver Disease and Risk of Incident Cardiovascular Disease: A Meta-analysis. J Hepatol. 2016;65:589-600.
- [CrossRef] [PubMed] [Google Scholar]
- Non-alcoholic Fatty Liver Disease and Metabolic Syndrome-Position Paper of the Indian National Association for the Study of the Liver, Endocrine Society of India, Indian College of Cardiology and Indian Society of Gastroenterology. J Clin Exp Hepatol. 2015;5:51-68.
- [CrossRef] [PubMed] [Google Scholar]
- Saroglitazar in Patients with Non-alcoholic Fatty Liver Disease and Diabetic Dyslipidemia: A Prospective, Observational, Real World Study. Sci Rep. 2020;10:21117.
- [CrossRef] [PubMed] [Google Scholar]
- Clinicopathological Profile and Outcome of a Large Cohort of Patients with Nonalcoholic Fatty Liver Disease from South Asia: Interim Results of the Indian Consortium on Nonalcoholic Fatty Liver Disease. Metab Syndr Relat Disord. 2022;20:166-73.
- [CrossRef] [PubMed] [Google Scholar]