

Translate this page into:
Coronary Physiologic Assessment Based on Angiography and Intracoronary Imaging
*Corresponding author: Jyotsna Maddury, Department of Cardiology, Nizams Institute of Medical Sciences, Hyderabad, Telangana, India. janaswamyjyotsna@gmail.com
-
Received: ,
Accepted: ,
How to cite this article: Reddy MS, Maddury J, Mamas MA, Assa HV, Kornowski R. Coronary physiologic assessment based on angiography and intracoronary imaging. Indian J Cardiovasc Dis Women 2023;8:200-10.
Abstract
Intracoronary physiology testing has evolved as a promising diagnostic approach in the management of patients with coronary artery disease. The value of hyperemic translesional pressure ratios to estimate the functional relevance of coronary stenoses is supported by a wealth of outcomes data. The continuing drive to further simplify this approach led to the development of non-hyperemic pressure-based indices. Recent attention has focused on estimating functional significance without invasively measuring coronary pressure through the measurement of virtual indices derived from the coronary angiogram. By offering a routine assessment of the physiology of all the major epicardial coronary vessels, angiogram-derived physiology has the potential to modify current practice by facilitating more accurate patient-level, vessel-level, and even lesion-level decision making. This article reviews the current state of angiogram-derived physiology and speculates on its potential impact on clinical practice, in continuation to the previously published article on coronary physiology in this journal.
Keywords
Angiography
Intracoronary imaging
Physiologic assessment

INTRODUCTION
When it comes to functionally evaluating the severity of coronary artery lesions, the fractional flow reserve (FFR) signal based on pressure wires is the gold standard.
The coronary circulation is a network of interconnected anatomical and physiological components that ensures the heart always receives sufficient oxygenated blood. The dynamic interaction between the contracting heart and vasculature is amplified at times of high demand, such as during exercise, lowering microvascular resistance, and increasing aortic pressure to ensure sufficient transmural perfusion of the left ventricle (cardiac-coronary coupling).
It is possible to offer a comprehensive evaluation of the epicardial and microvascular compartments by continuously monitoring the distal coronary pressure and flow under different physiological situations. However, microsensor-tipped guidewires have made these techniques clinically viable. Methods exist for determining the significance of stenosis-based solely on pressure measurements because the pressure drop across an epicardial artery stenosis is related to blood flow through the stenosis and because pressure is (more or less) linearly proportional to flow under certain circumstances.[1]
The main problem with FFR based on wires is that it needs maximal hyperemia. FFR has not been frequently used in the cardiac catheterization laboratory to assess coronary physiology despite its therapeutic advantages. Non-hyperemic pressure ratios, such the instantaneous wave-free ratio, have emerged in recent years as viable alternatives to FFR.[2,3] Wire-based functional testing has come a long way without adenosine or nicorandil administration, albeit a pressure wire is still necessary.
Recently, with the advent of new technologies, novel physiologic indices have been validated against wire-based FFR. These indices have not been investigated in large randomized trials, but they do eliminate the need for pressure wire and hyperemia. These new methods have the potential to simplify the catheter laboratory process by removing some of the obstacles associated with wire-based indices.
ANGIOGRAPHY-BASED FFR
In an effort to prevent coronary artery instrumentation, angiographic modeling of coronary hemodynamics was established over four decades ago and has lately acquired popularity. The quantitative flow ratio (QFR), vessel FFR, FFR angio, and coronary angio FFR are currently employed angiography-based indicators (Computational pressure-flow dynamics derived FFR [caFFR]). All these methods are based on three-dimensional reconstructions of the coronary tree that were built by stacking several angiographic projections. The concept of a TIMI frame count is used to compute coronary hemodynamics using computational fluid dynamics (CFD), with computations employing methods that are the unique and exclusive property of the different vendors.
FFR ANGIO
The coronary artery can be reconstructed in 3D from 2D images using an artificial intelligence-based technology based on two or three angiographic projections separated by at least 30°. The entire coronary tree is displayed and different views of its various branches and regions are available. FFR angio is calculated using a quick pressure-flow analysis by comparing the maximum flow rate through the stenosed channel to the maximum flow rate through the unobstructed channel [Figure 1].
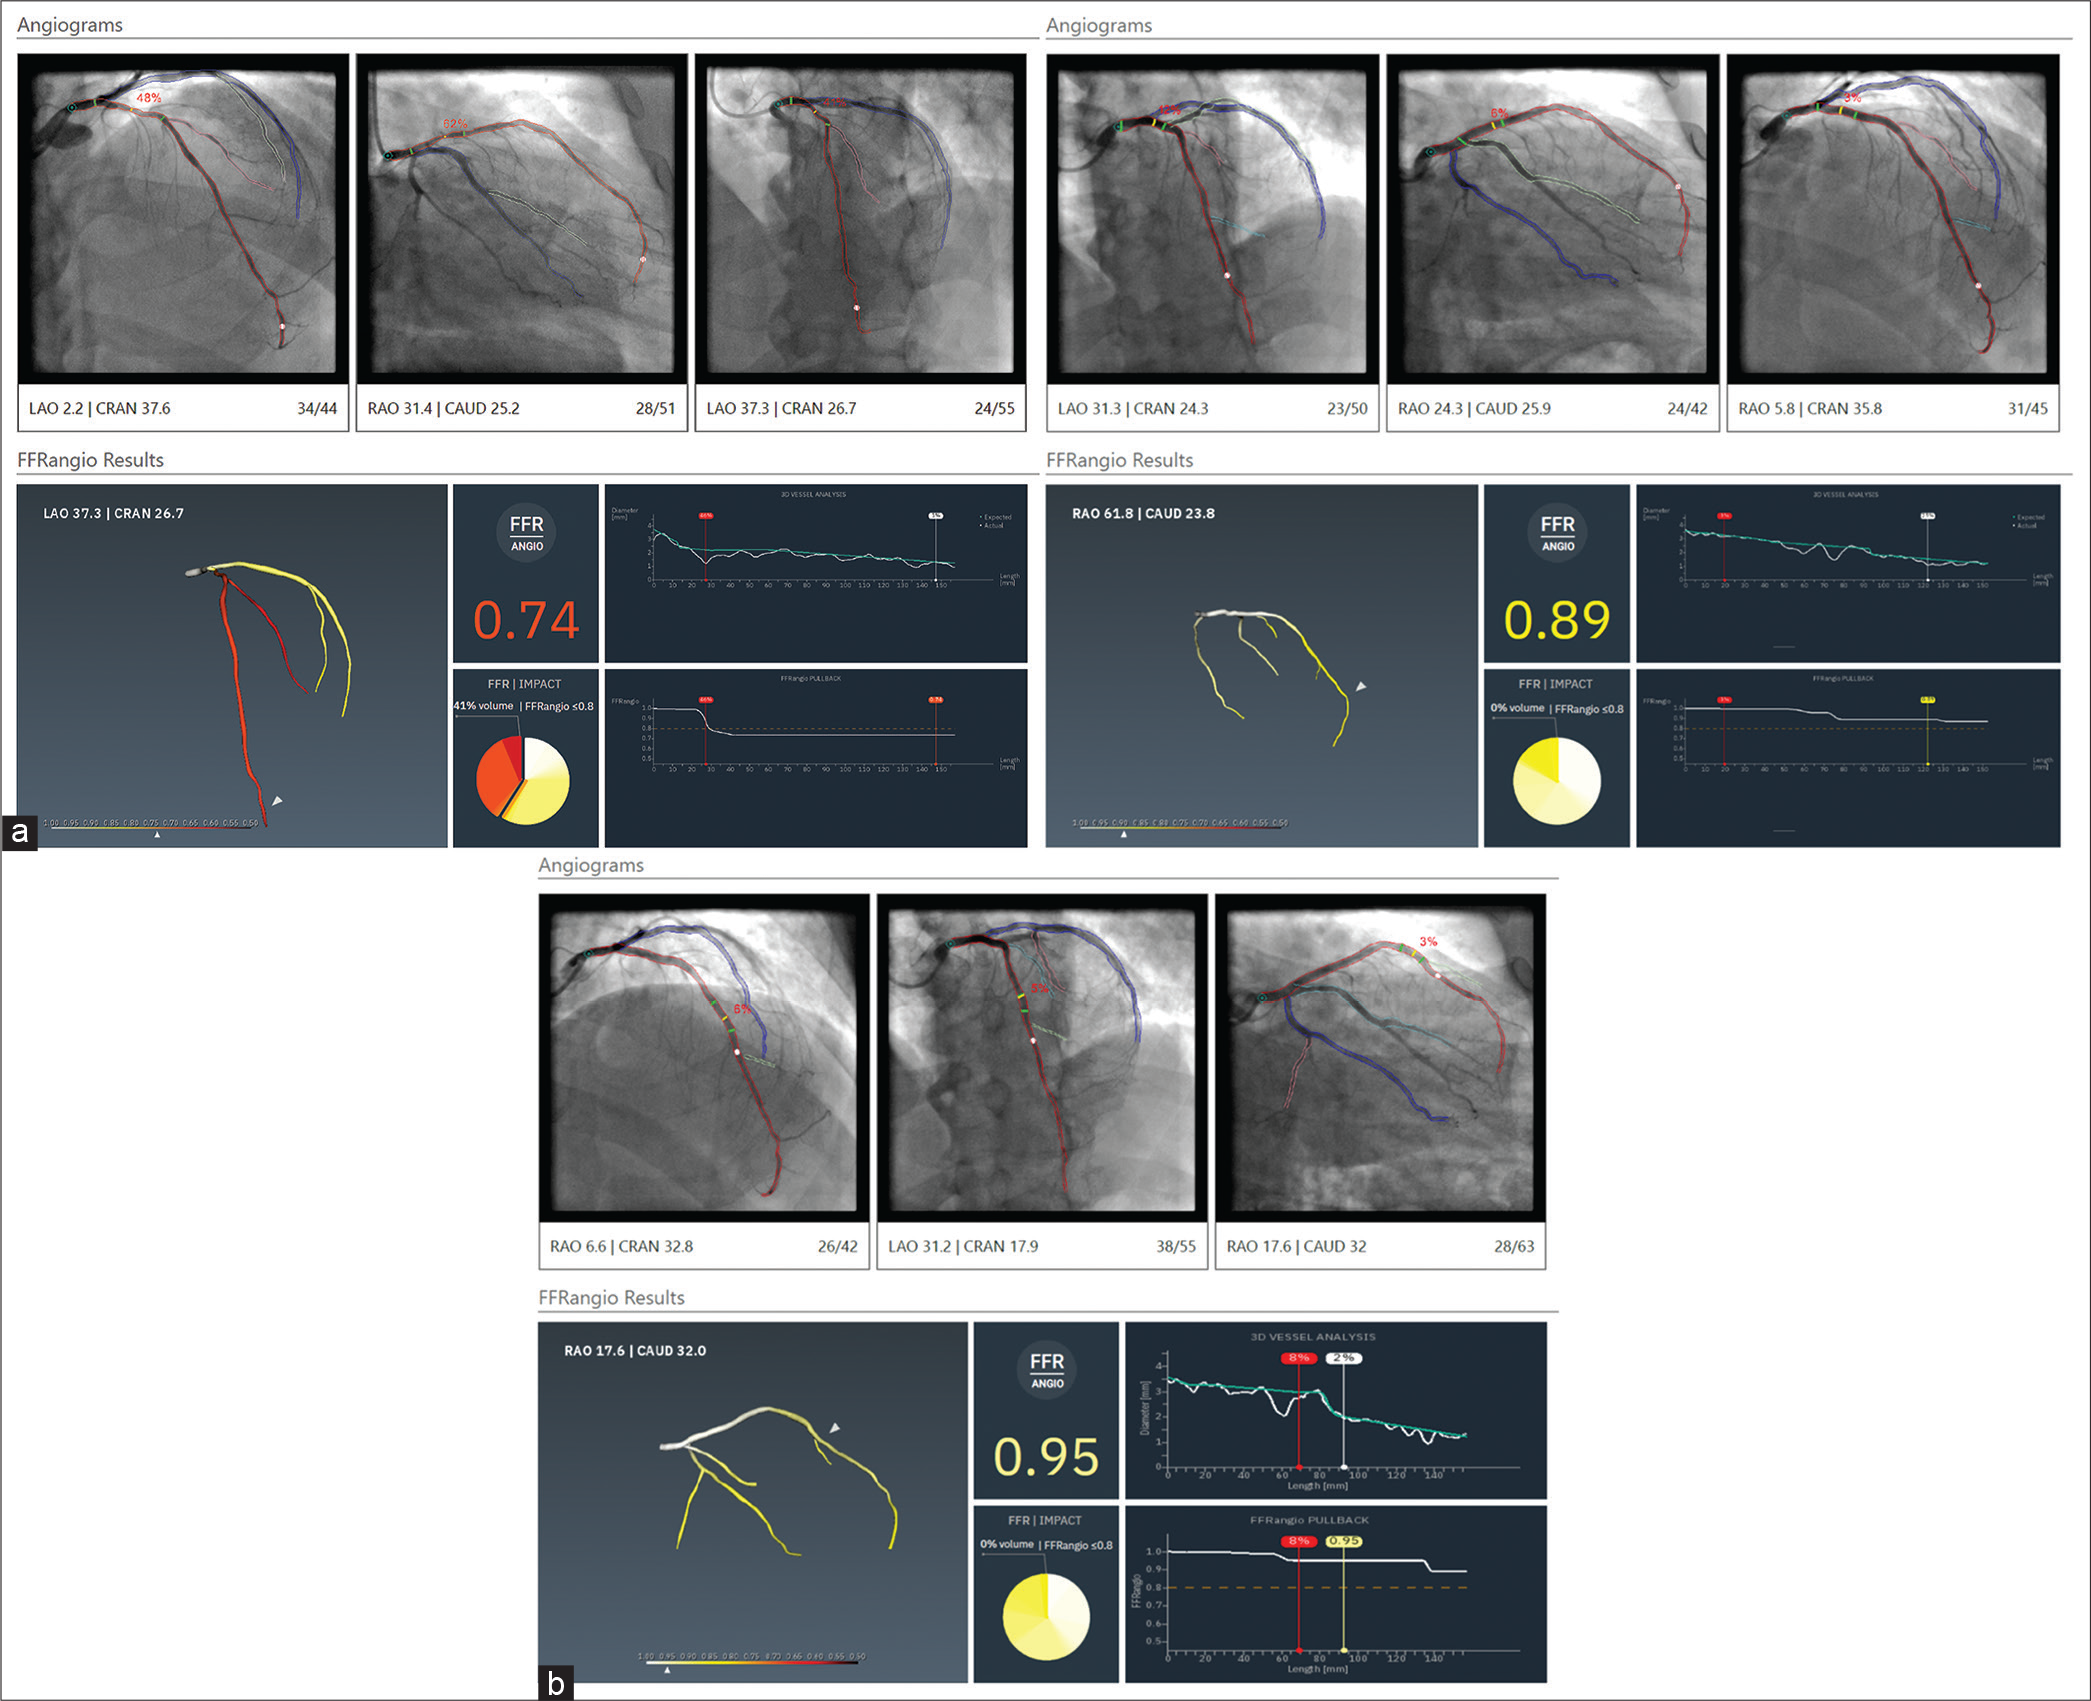
- Angiographic reconstruction of the Left anterior descending artery and computation of fractional flow reserve. (a) Pre-percutaneous coronary intervention, (b) post-stent deployment, and (c) post-stent optimization.
When compared to invasive FFR, Kornowski et al. found that FFR angio had better diagnostic performance (88% sensitivity, 98% specificity, and 94% diagnostic accuracy). Eighty-eight individuals with stable angina took part in the study.[4]
A FAST-FFR trial, which is a prospective, multicenter, and international trial employing an updated version technology from CathWorks, requires only two angiographic projections for the 3D reconstruction. A per-vessel examination of the study showed promising results when compared to an intrusive pressure wire, with sensitivity of 94%, specificity of 91%, and accuracy of 92%. Post hoc analysis of the FAST-FFR research also demonstrated that lesion features such as calcification and tortuosity did not influence the study’s sensitivity or specificity.[5] However, higher body mass index, >70% stenosis, and right coronary artery (RCA) lesions were all linked to lower accuracy (86.4%, 87.5%, and 88.6%, respectively). A reduced specificity was seen for lesions in the left circumflex artery (LCx) and the RCA during the FAST-FFR assessment. Overestimating the level of maximum hyperemia as a result of the smaller cardiac mass present in these locations may be to reason for the lower efficiency seen. More research is required to understand how territory affects FFR angio’s diagnostic accuracy. One of the key benefits of this model is how quickly it can analyze data while yet producing an accurate 3D reconstruction that includes even the tiniest of branches (down to 0.5 mm). Again, however, the model’s ability to capture subtleties in hemodynamic flow and translesional pressure dynamics is called into question by the numerous assumptions underlying the mathematical solution.[6]
QFR
With the advent of the QFR, a unique non-invasive approach has been established to evaluate the hemodynamic importance of coronary stenoses without the use of vasodilators. A 3D model of the target vessel is constructed based on two angiographic projections with a minimum separation of 25°.[7] A quadratic function may be used to estimate contrast flow velocity acquired from frame-count analysis to determine an individual’s particular virtual hyperemic flow velocity. After segmenting the vessel, the program determines its QFR. Similar to FFR angio, QFR shortens the time, it takes to evaluate a patient’s physiological status by around 30% compared to traditional wire-based FFR.[8]
QFR analysis
To evaluate QFR, specialized software (QAngio XA 3D version 1.2, Medis Medical Imaging Systems) is used [Figure 2]. When possible, it is preferable to utilize the angiographic projections recommended by the QFR software’s developer to ensure an accurate QFR computation. The contrast QFR is calculated when the vessel diameter is smaller than 2.0 mm by counting the frames between the index vessel’s ostium and a distal anatomic landmark that is discernible in both projections. Distal endpoints are selected at a minimum vessel diameter of 1.5 mm when the proximal reference diameter of the vessel is between 2.5 and 2.0 mm. The typical threshold is −0.80.[9,10] The following are some exclusion criteria inappropriate for a QFR analysis: The lack of isocenter calibration, major artery overlap or foreshortening, severe vascularity, poor contrast, TIMI flow ≤2, tachycardia more than 100 beats/min, atrial or ventricular atrial fibrillation, ostial left main or ostial right coronary stenosis, 1,1,1 Medina-classified singularity lesions, and vessels with retrograde flow are some other factors.[8-10]
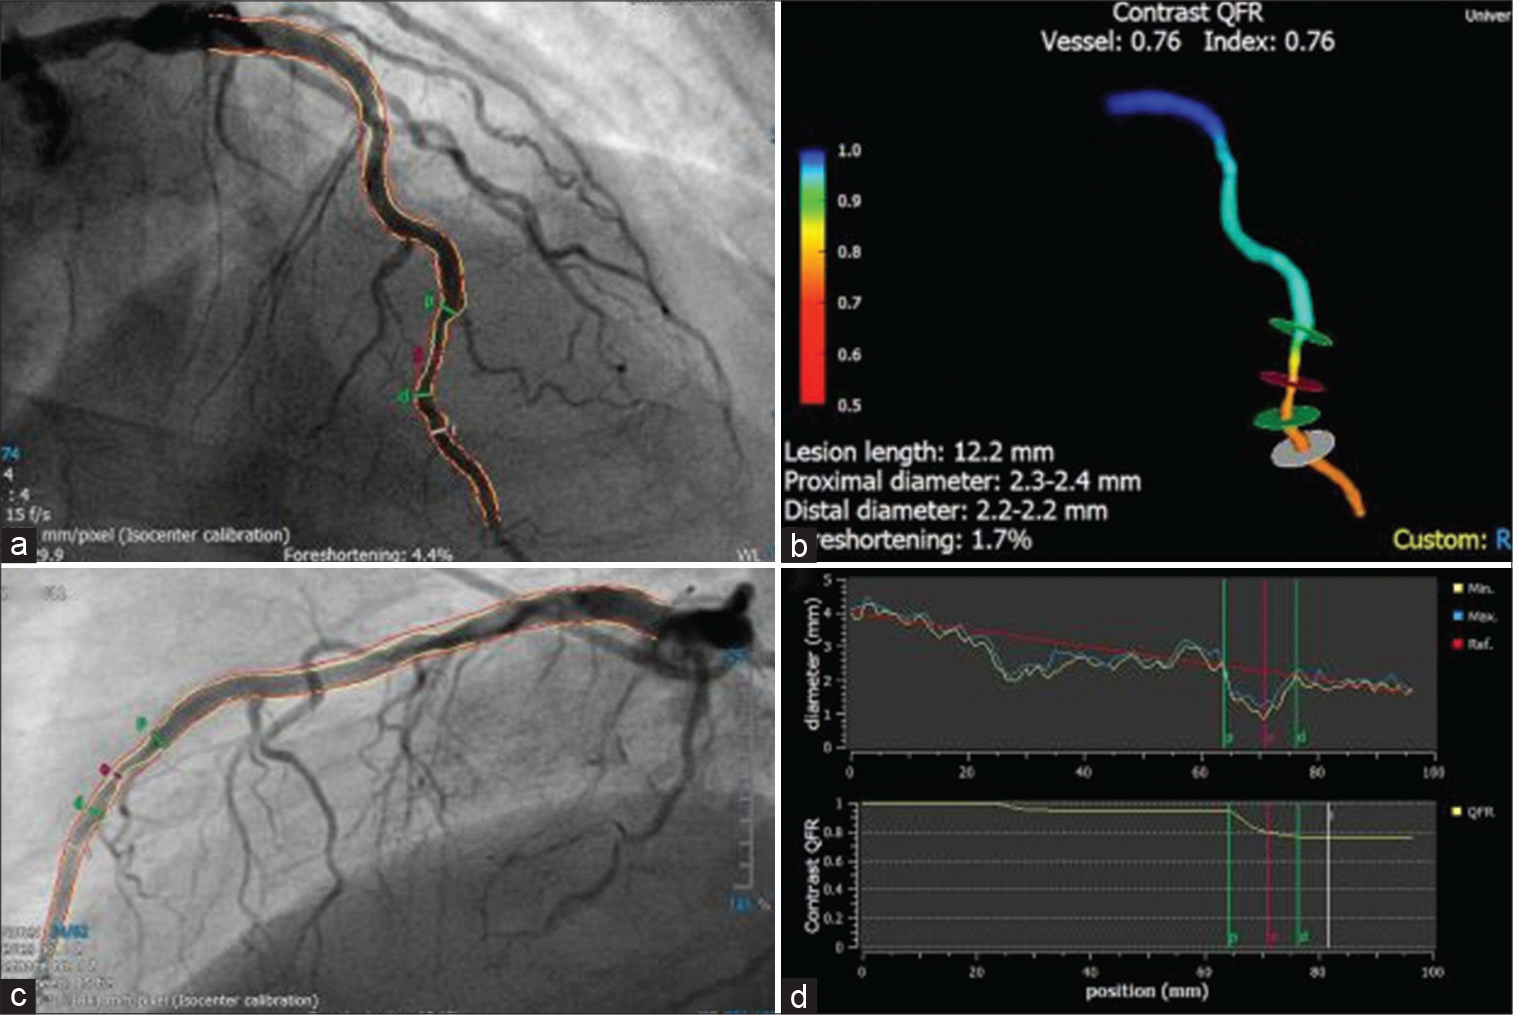
- Quantitative flow ratio (QFR) analysis (Courtesy of Xu et al.). An illustration of how angiography might have missed a revascularization signal in the left anterior descending artery, that was significant on QFR with value of 0.76. Here are some pictures showing the vessel’s diameter and QFR curves as measured along its length: (a and b) two angiographic projections separated by a 25° angle; (c) a 3D reconstruction of the vessel; and (d) vessel diameter, and QFR curves over the length of the vessel.
In the Functional Assessment by Various Flow Reconstructions (FAVOR) Pilot study,[8] the FAVOR (Functional Diagnostic Accuracy of QFR in Online Assessment of Coronary Stenosis) II China,[9] and the FAVOR II Europe-Japan studies,[10] the diagnostic performance of QFR was shown. Based on a recent meta-analysis that included 819 patients and 969 lesions along with the Wire-Free Functional Imaging II Study,[11] QFR was found to have excellent diagnostic performance in identifying coronary stenosis with hemodynamic significance, as defined by FFR 0.80 (sensitivity 84%, specificity 88%, positive predictive value [PPV] 80%, negative predictive value [NPV] 95%, and area under the receiver operating characteristic curve (AUC] 0.92).[12] A recent large-scale, multicenter, and observational registry with 599 vessels in 452 patients was used to assess QFR’s diagnosis accuracy across a broad range of clinical and patient subgroups. QFR has demonstrated excellent diagnostic accuracy in predicting the functional significance of coronary stenoses regardless of patient variables such as sex, diabetes mellitus, or lesions of the acute coronary syndrome. This method outperformed FFR angio for diagnosing lesions in the RCA and LCX (sensitivity 92%; specificity 91.6%; AUC 0.96). The predictive importance of QFR was also investigated in this observational study and it was shown that vessels with a QFR of 0.80 were more likely to have a vessel-oriented composite outcome. Using cardiac mortality, target-vessel myocardial infarction, and ischemia-driven target lesion revascularization, the researchers explained the outcome.[13] QFR-guided technique to lesion selection yielded superior clinical outcomes at 1 year compared to standard angiography guidance in a study of 3825 patients undergoing percutaneous coronary intervention (PCI) in FAVOR III China.[14]
Applications of QFR
Recent research shows incremental diagnostic and prognostic improvement over angiography alone in STEMI patients treated with QFR, even in non-culprit lesions. Due to its ability to predict future unfavorable events like spontaneous MI and revascularization related to NCLs without the need for additional measures beyond diagnostic angiography and specialized software, the safe and noninvasive QFR procedure may be of particular importance to streamlining the effective workflow for patients with STEMI.[12]
VIRTUAL (COMPUTED) FRACTIONAL FLOW RESERVE (VFFR)
vFFR is an innovative method of calculating FFR using CAG images and CFD, without the need of pressure wire. The CAAS Workstation software (Pie Medical Imaging) is a platform for quantitative coronary angiography that has been successfully verified and is used for vFFR measurements (QCA). Two independent angiograms taken at a 30° angle can be combined to provide a three-dimensional image of the coronary artery. The program uses physical criteria to determine vFFR, which is calculated as the ratio of a patient’s unique aortic pressure to the distal coronary pressure. Viscous resistance and a physical change in coronary flow behavior are some of these requirements. The important steps in using VIRTUheartTM are obtaining an accurate 3D model of the diseased coronary artery and estimating the microvascular resistance [Figure 3]. The former requires a good quality angiogram, with optimal opacification, minimal magnification, no “panning” and minimal vessel overlap in at least two orthogonal planes at least 30° apart, ideally with an ECG trace to identify an end-diastolic frame. Accuracy requires both a precise microvascular resistance (MVR) calculation and an accurate lesion representation. Without a wire measurement, MVR is often calculated using a combination of demographic averages and customization [Figure 4].[15-17]
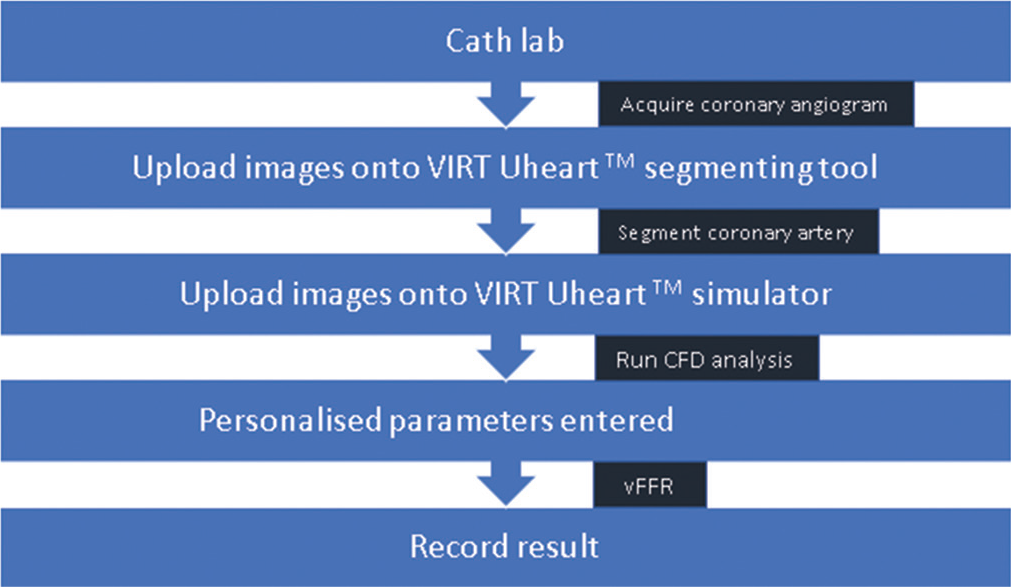
- Steps for vFFR calculation using the VIRTUheartTM software. vFFR: Virtual (COMPUTED) fractional flow reserve.
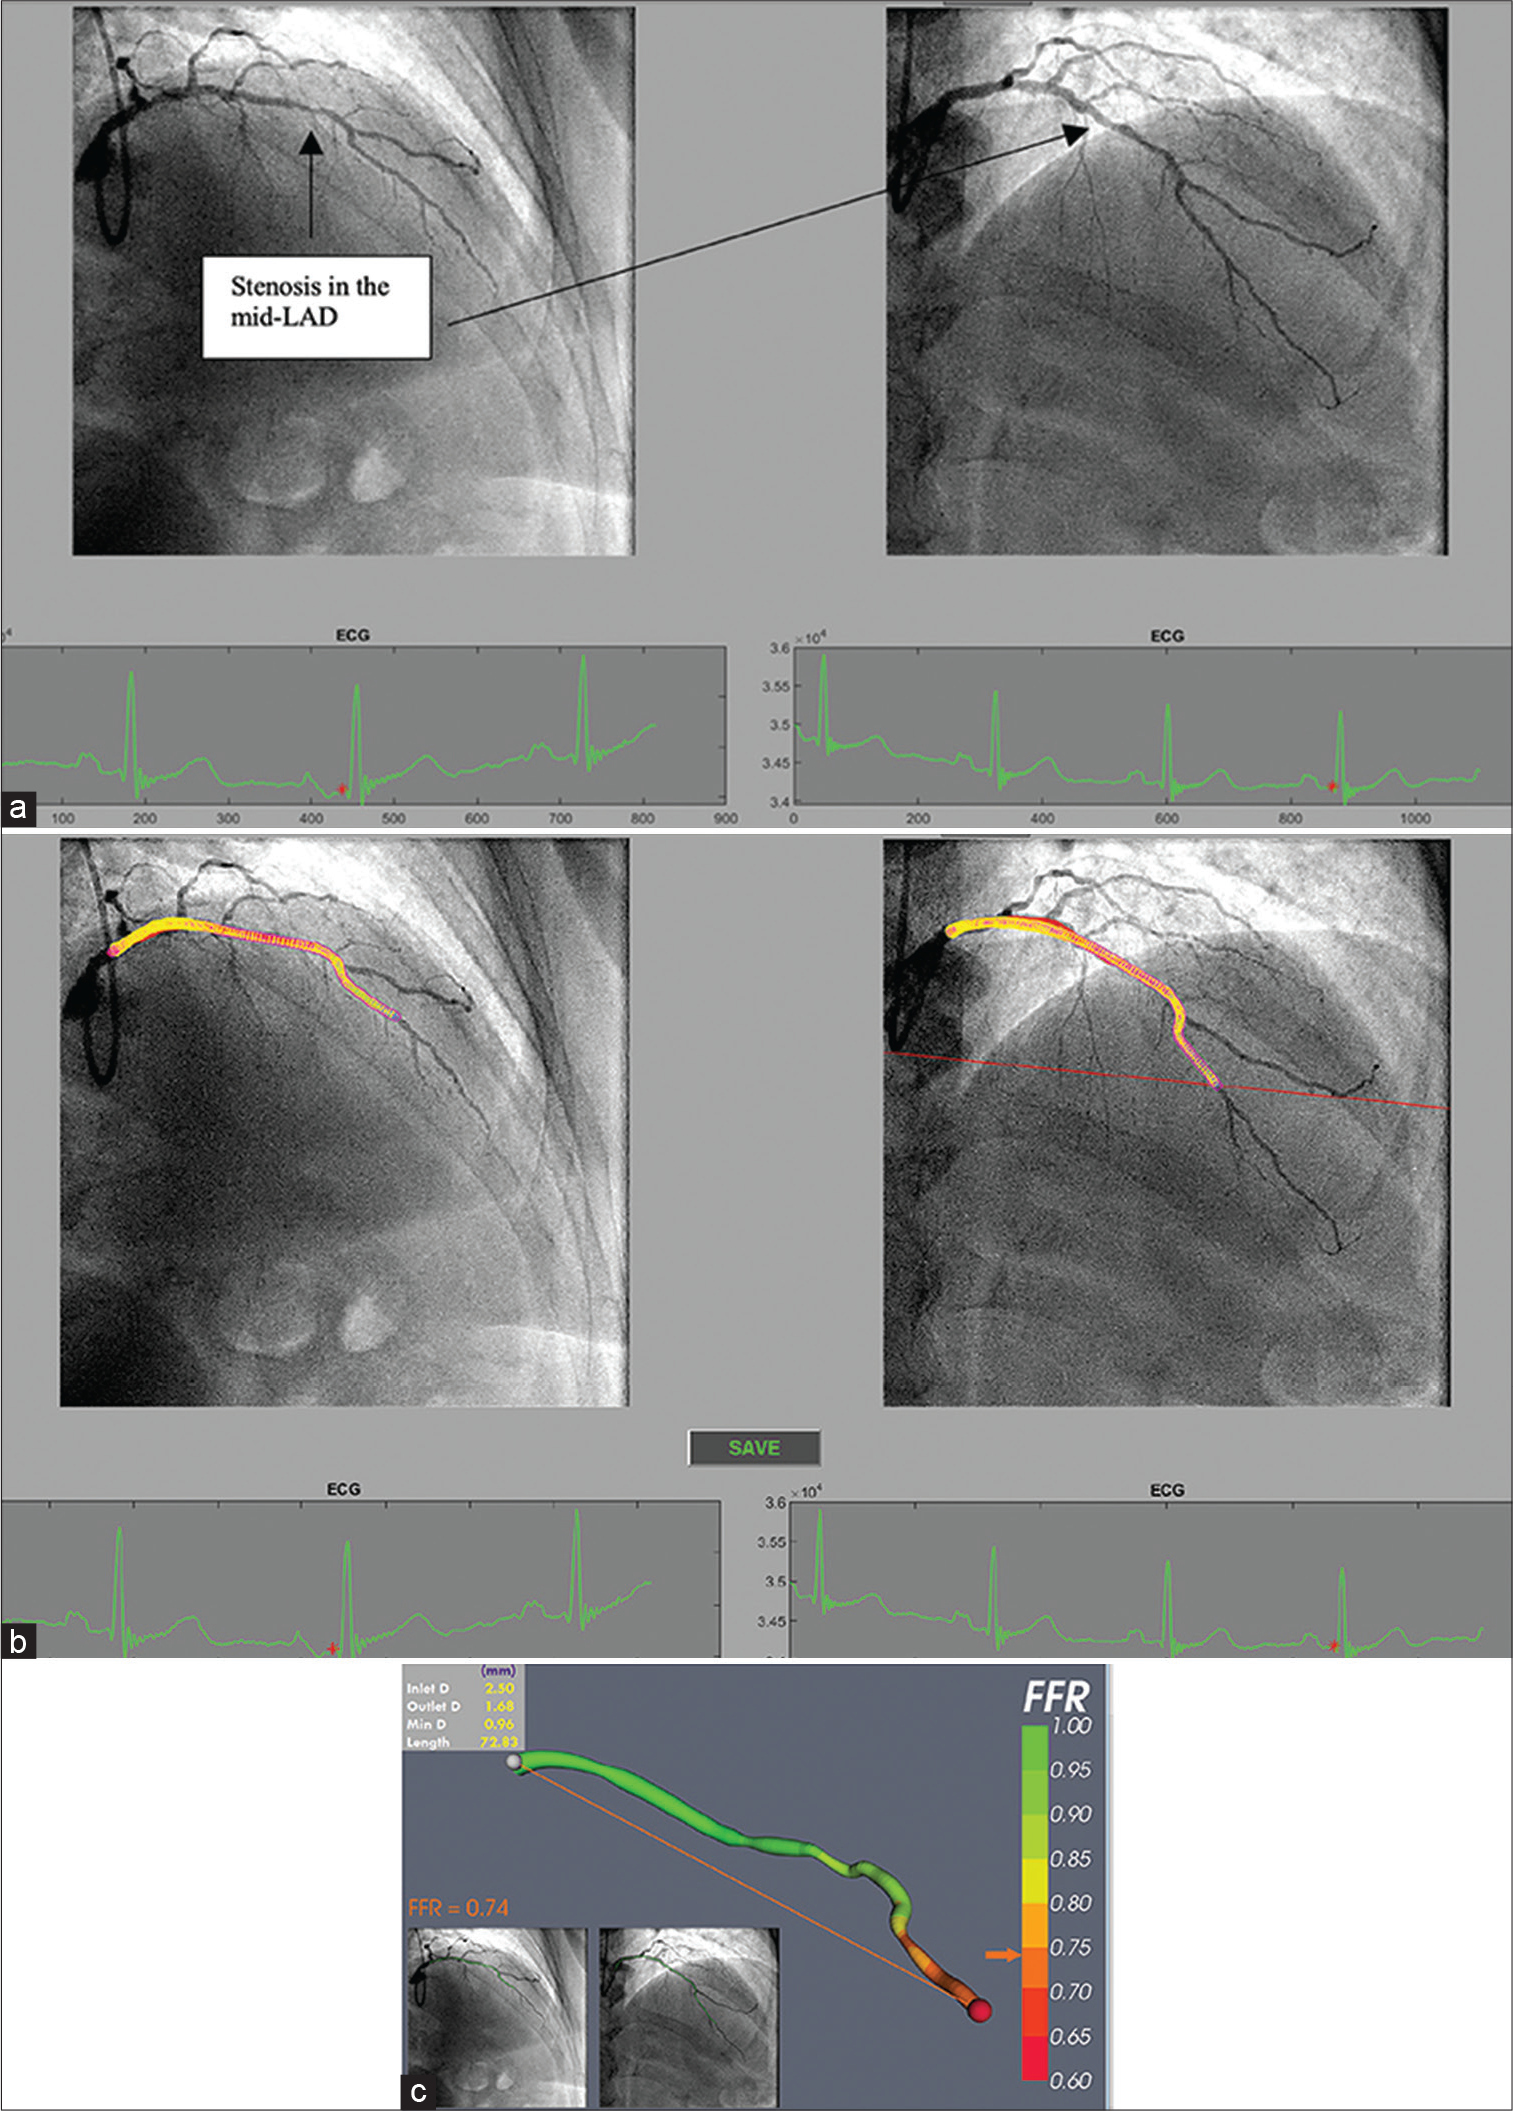
- (a) Processing selected angiogram images. Two views (at least 30° apart) of the LAD are chosen at end diastole (red dot on ECG tracing) from a patient with NSTE-ACS. (b) The LAD artery is now segmented and ready for a 3D reconstruction before computational fluid dynamics (CFD) simulation. (c) Virtual (COMPUTED) fractional flow reserve (vFFR) result after 3D reconstruction and CFD simulation showing a vFFR in the LAD of 0.74 (Courtesy of Hazel Arfah Haley et al.).
EVIDENCE FOR VIRTUAL CORONARY PHYSIOLOGY
In the FAST (Fast Assessment of Stenosis Severity) study that included a total of 100 patients, vFFR had a high correlation with FFR (r = 0.89), and its measurement was associated with low inter-operator variability (r = 0.95).[18] The results of FAST II study which included 330 participants in a prospective fashion are promising with a good correlation found between core lab vFFR and pressure wire-based FFR (R = 0.74; P < 0.001; mean bias 0.0029 ± 0.0642).[19]
caFFR
The caFFR index is a new technique for the physiological assessment of the severity of coronary artery stenosis based on angiographic images. Calculating the pressure drop from the coronary ostium to every location in the vessel and determining the caFFR value of each location in the vessel can be done using fluid mechanics, the TIMI frame counting technique, an optimized CFD program, and the two-dimensional analysis and three-dimensional reconstruction of two coronary angiography image series with an angle-off >30°. CaFFR is cutting edge because it uses a pressure transducer to monitor aortic pressure in real-time (FlashPressure, Rainmed Ltd.). Taking the mean aortic pressure across five heartbeats yields the hyperemic aortic pressure. Counting frames to build a baseline velocity allows one to automatically calculate the hyperemic flow velocity. In the end, a pressure decrease across the lesion is calculated using a unique pressure-flow dynamics computational approach (CPFD). The Accuracy of Computational Pressure-Fluid Dynamics Applied to Coronary Angiography to Derive FFR (FLASH FFR) study used a prospective and multicenter analysis of 328 lesions in 328 patients to evaluate the feasibility of the caFFR system and the diagnostic performance of the caFFR using invasive FFR as the gold standard. Consistently superior diagnostic performance was demonstrated by the data (sensitivity 90%, specificity 99%, PPV 97%, NPV 95%). R = 0.89 demonstrated a very strong connection. Getting a caFFR value took just 4.5 min to run, with the computation time being <1 min of that.[20] Clinical outcomes and health-care expenditures were compared between the caFFR-guided approach and the FFR-guided strategy in the Flash FFR II study, a prospective, multicenter, randomized, and non-inferiority trial is currently ongoing.
Accurate measurement of angiography-based indices
High-quality image capture and precise reconstruction of the coronary artery’s morphology are crucial since the validity of angiography-based indices is heavily reliant on the caliber of the angiograms themselves. In particular, the target vessel should be scanned in a perfect field of view without shifting the table following intracoronary injection of nitroglycerine. When imaging particular lesion segments, it is best to do so from the appropriate projection angles to reduce the likelihood of overlap between side branches and foreshortening of the artery. Selecting the lumen boundary may take some manual tweaking, although better images may shorten the procedure time. When applying these cutting-edge techniques, it is crucial to take the lesion’s location into account in addition to its vessel characteristics. Such a method may not be appropriate for aorto-ostial stenoses, for instance, since an inserted guide catheter and contrast backflow might lead to erroneous 3D reconstruction. The previous studies often excluded patients with severe widespread disease, left main stenosis, or bifurcation lesions since it was advised that these patients be investigated differently.
Imaging-based FFR
Optical coherence tomography (OCT) and intravascular ultrasonography (IVUS) are imaging modalities that might guide and enhance PCI techniques. Functional assessments of coronary lesions are hampered by the fact that cross-sectional and two-dimensional data like minimal lumen area (MLA) have poor to moderate diagnostic accuracy for predicting FFR <0.8 in arteries other than the left main coronary artery.[21,22] The same methods used to compute FFR from angiography have been tried so far to calculate FFR from IVUS or OCT images.
IVUS-BASED FFR (ULTRASONIC FLOW RATIO [UFR])
An innovative technique for rapidly computing FFR using intravascular ultrasound images is the UFR. To calculate UFR, we first had to rebuild the geometric model and then calculate the pressure loss during the imaging pullback. The external elastic lamina (EEL) and artery lumen outlines should first be automatically defined by a deep learning algorithm, and these characteristics should subsequently be recreated in 3D.[23-27] Emphasis is placed on the use of the high-performance semantic segmentation network RefineNet.[28] The network had to be trained on IVUS pictures that had been highlighted by experienced IVUS analysts for it to understand how to extract the lumen and media. To differentiate between the lumen and the intima, IVUS may record the pattern of blood flow speckles in the network using a number of cross-sectional pictures. If automatically created outlines strayed too far from the lumen and EEL borders, they might need to be changed manually. Second, the areas of the offshoots were calculated by modeling the Ostia perpendicular to their respective axes. The end result is shown in [Figure 5] when determining the size of the healthy lumen assuming there was no stenosis, the bifurcation fractal laws[23] were used to assume that the lumen would only constrict at the bifurcation points. To calculate the downstream perfused flow, we used a hyperemic flow velocity of 0.35 m/s to the reference lumen area. The UFR pullback was calculated by first estimating the pressure drop at each cross section along the pullback using a well-established computational FFR technique based on fluid dynamic equations.[23-25] A cutoff value ≤0.80 was used for UFR to define the physiological significance of coronary stenosis. From the time, IVUS photos were uploaded until UFR was acquired, the median analysis time was 102 (IQR, 87–122) s [Figure 6].
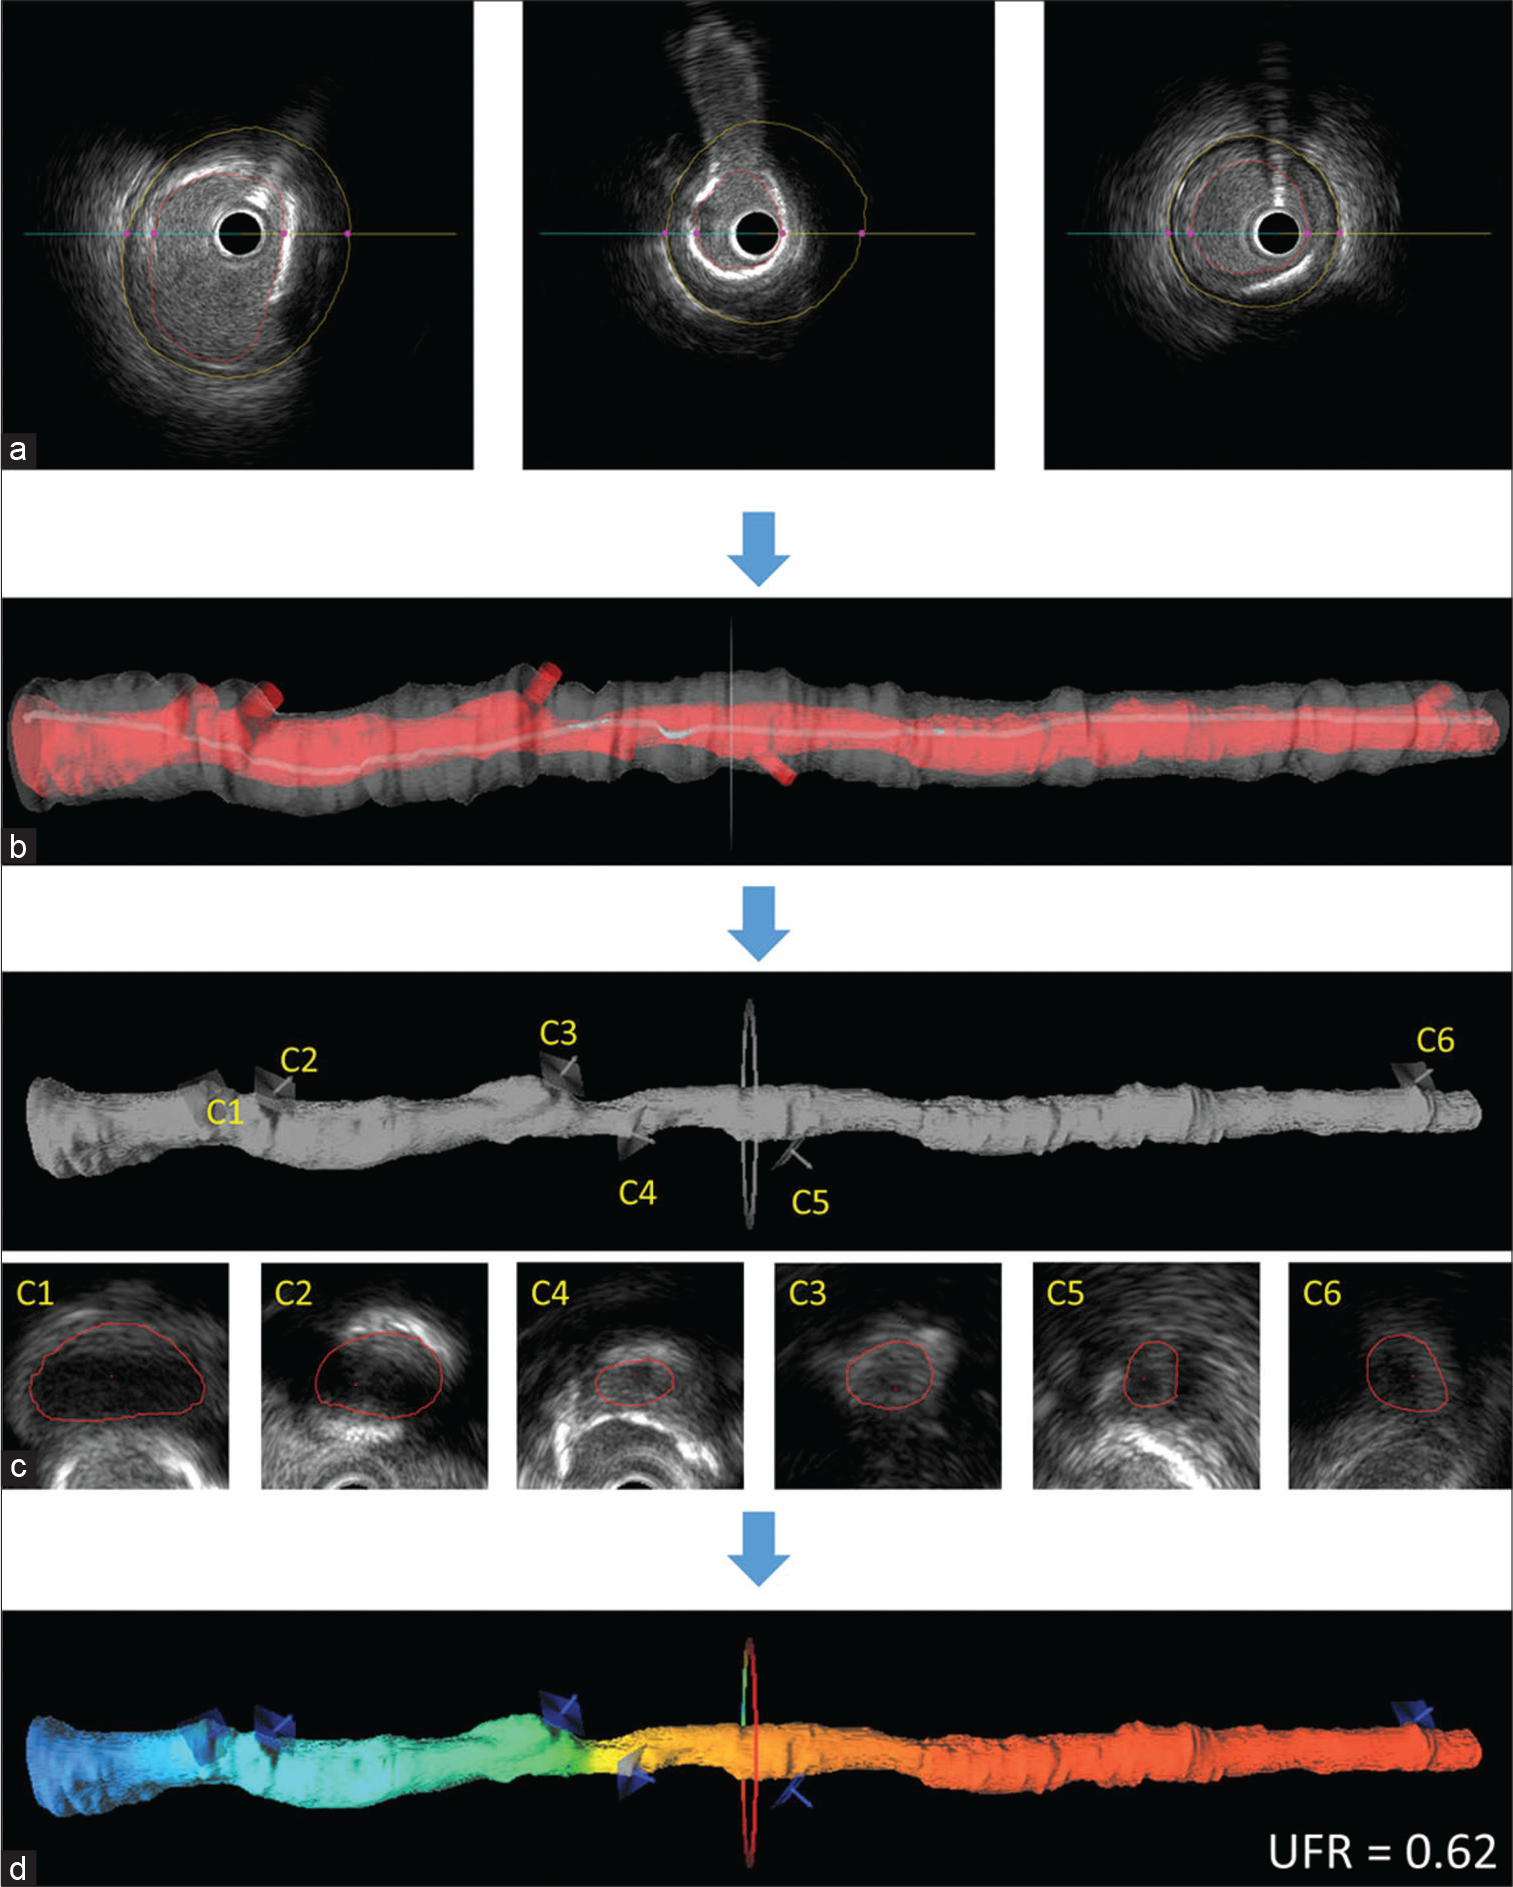
- An illustration of how to determine the ultrasonic flow ratio (UFR). Artery lumen contours and the external elastic lamina were delineated using artificial intelligence (a) and reconstructed in 3-dimensional (3D; b). The ostia of branching vessels were recreated and measured in this work (c). The ostia of the offshoots are shown by the C1-C6 contours. The rebuilt 3D intravascular ultrasonography lumen was then overlaid with the estimated UFR pullback (d) (Courtesy Wei Yu et al.).
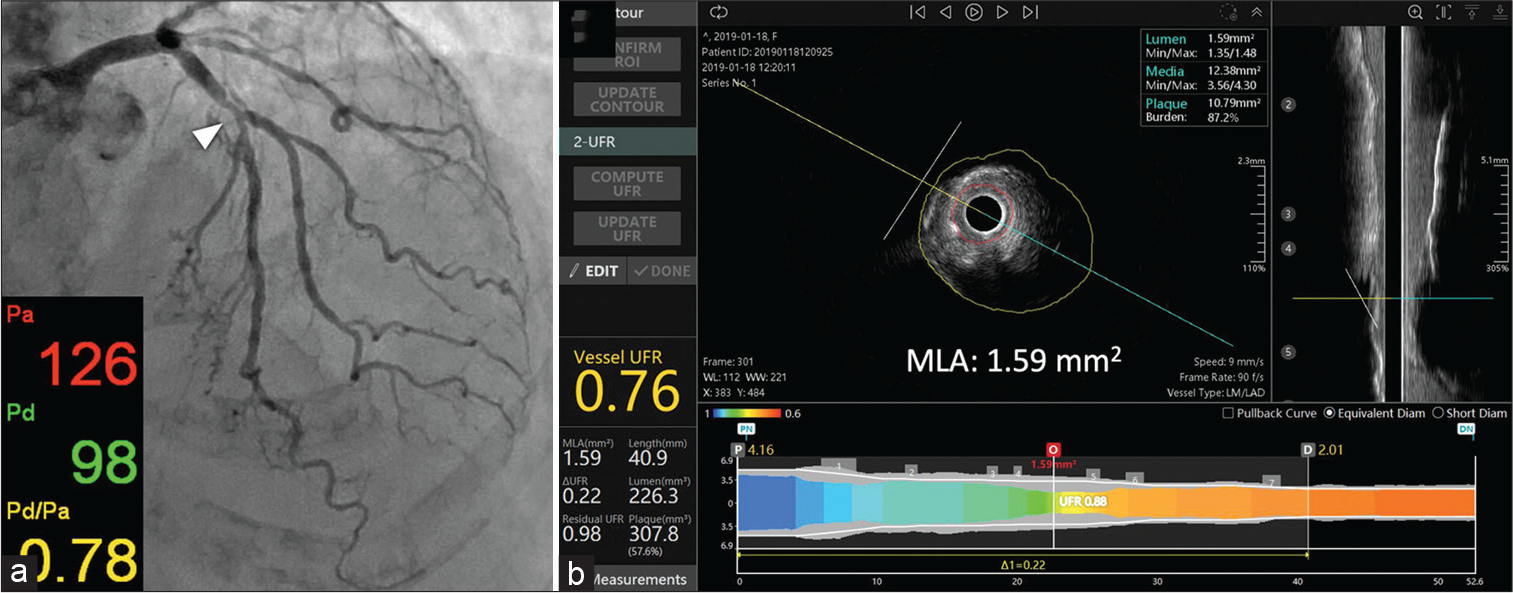
- Intravascular ultrasonography (IVUS) can be used to calculate fractional flow reserve (FFR). Coronary angiography showed significant stenosis in the proximal left anterior descending artery (arrowhead) with a wire-based FFR value of 0.78 (a). (b) Automatic tracing of the lumen and the exterior elastic lamina for 3D vessel reconstruction after probing. The IVUS-derived FFR (ultrasonic flow ratio) value was determined to be 0.76. (Courtesy of Tatsunori Takahashi et al.).
OCT-derived FFR (OFR)
OFR is a novel technique allowing the assessment of flow-limiting coronary stenosis without the use of a pressure wire or artificially induced hyperemia. More research has been done on OFR, making it the preferred method of determining FFR using OCT. A prototype software application can calculate the OFR and draw the lumen for an experienced analyst who is blinded to the FFR data (OctPlus; Pulse Medical Imaging Technology, Shanghai, China).
For each OCT image pullback, the lumen of the coronary artery is automatically delineated and the side branches are automatically detected. Subsequently, the cut-plane perpendicular to the side branch centerline is reconstructed and the area of the side branch ostium in the cut-plane is computed.[29] Next, the step-down behavior across bifurcations is included into the calculation for the reference vessel size according to the principles of bifurcation fractals (the healthy lumen as if there were no stenosis).[30] Assuming the flow is incompressible, the concept of mass conservation may be applied using the area-preservation model. The final step, which uses a unique methodology derived from an adapted and true computational FFR method, is to compute the OFR value at each place along the probed vessel using the intake boundary. Multiplying the area of the proximal reference lumen shown on OCT by a made-up hyperemic flow rate of 0.35 m/s yields the hyperemic volumetric flow rate. The computed OFR values are used to color code the rebuilt artery, with the value at the furthest location being compared to FFR [Figure 7]. The location of the cut plane and the lumen shape may be manually adjusted if necessary due to poor OCT picture quality or imaging artifacts.” The process may be automated in its entirety otherwise. With a high sensitivity (87%) and specificity (92%), as well as a quick analysis time (<1 min on average 29–31), OFR proved to be an effective diagnostic tool for predicting FFR ≤0.80.[31]
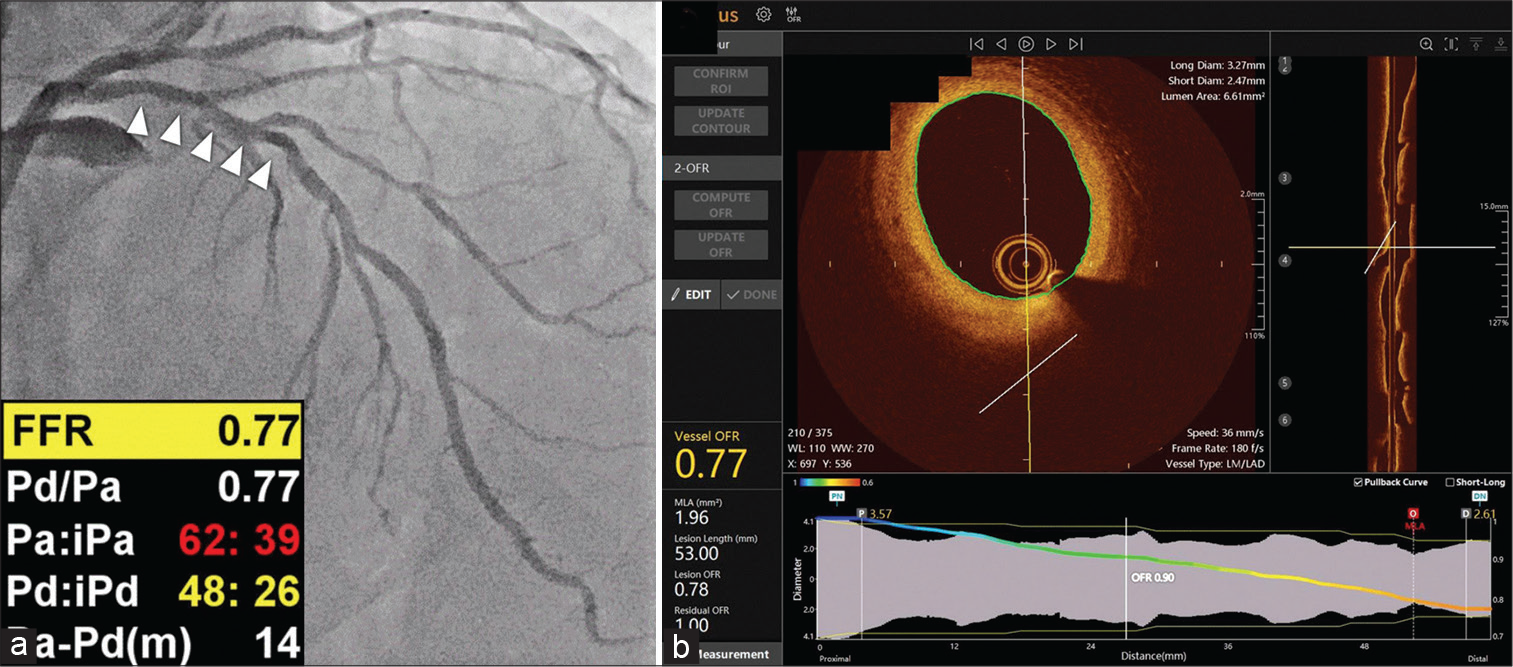
- An example of optical coherence tomography (OCT)-derived fractional flow reserve (FFR). (a) Coronary angiography revealed angiographically intermediate stenosis in the proximal part of the left anterior descending artery (arrowheads) with a wire-based FFR value of 0.77. (b) Images obtained from OCT using the FFR value in OctPlus software (Courtsey of Kleanthis Theodoropoulos et al.).
Without the necessity for 3D vessel reconstruction, Seike et al. devised a unique approach for predicting OCT-based FFR using fundamental fluid dynamics. Their method for determining FFR exhibited a greater connection with wire-based FFR (r = 0.89) compared to MLA (r = 0.68) and % area stenosis estimated by OCT (r = −0.7032). However, more research is needed to confirm their findings, which show that FFR may be predicted from OCT data using a simple fluid dynamics equation. Abbott is now supporting the prospective and multicenter FUSION (functional diagnosis of coronary stenosis) study, which will compare the diagnostic performance of an OCT-derived FFR (Virtual Flow Reserve: VFR) to that of a wire-based FFR in roughly 310 patients.[32]
Angiography-based indices future direction
Recent research has shown that wire-based FFR and angiographic FFR correlate well, and the latter provides a reasonably quick physiologic evaluation of coronary stenosis. An angiography-based FFR may become a standard tool in clinical practice for determining the indication for PCI if randomized and controlled trials show non-inferior or superior clinical outcomes compared to a pressure-wire guided strategy or an angiography-guided strategy (PCI). One-year results from the DEFINE-PCI (Physiologic Assessment of Coronary Stenosis Following PCI) study recently shown the positive correlation between an iFR of 0.95 following PCI and clinical outcomes.[33] From a physiological perspective, it is crucial to enhance PCI, and focus is shifting in that direction. Mavromatis et al. claim that trans-stent FFR gradient (TSG) of >0.04 is similarly linked to poor long-term outcomes following PCI.[34] After PCI, FFR based on angiography may be used to assess physiologically effective revascularization; however, the usefulness of this method after PCI has to be studied [Figure 8]. Since fewer stents would be inserted and the use of an expensive pressure wire will be eliminated, angiography-based FFR is anticipated to result in lower medical expenses. As a result, cost-benefit evaluations would still be necessary to demonstrate that a revascularization approach based on angiography-based FFR is cost-effective.
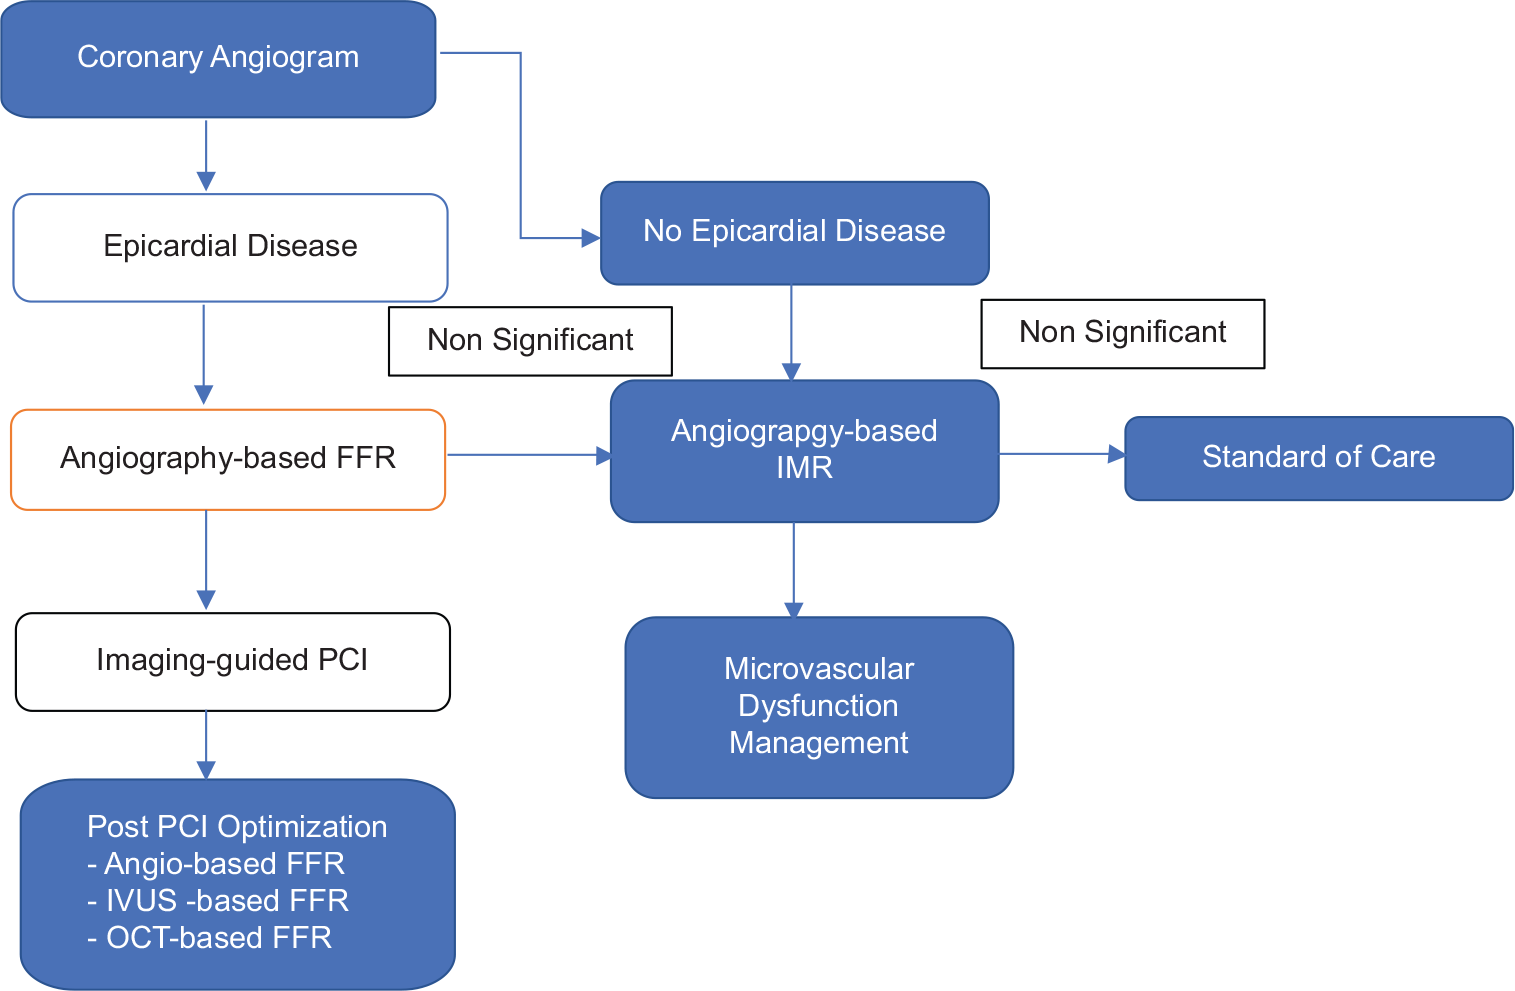
- The future of coronary artery disease evaluation.
The physiological assessment of coronary lesions is influenced by the pattern and distribution of coronary artery disease (CAD), including focal lesions, serial lesions, diffuse disease, and mixed patterns. Different CAD patterns have an impact on the accuracy of physiological indicators obtained from pressure wire and angiography, with diffuse disease in particular being a key sign of what to anticipate after PCI. The longitudinal functional assessment provides a third dimension to CAD characterization, in addition to the angiographic and functional evaluation of lesion significance.[35]
CONCLUSION
Angiography-derived coronary physiology techniques have made significant strides and been compared to the gold standard of invasive FFR. The functional relevance of stenoses in all epicardial coronary vessels may be evaluated with no added risk using any of the methods now available; however, there are still methodological hurdles to be resolved. They provide virtual pull-back at various levels of coronary tree, enabling a more thorough investigation of the lesion and vessel levels. Intravascular imaging-based FFR has not been widely employed in clinical practice since there are few prospective studies investigating its predictive efficacy, safety, and cost-benefits. Role of imaging-based FFR in aorto-ostial lesions and left main stenoses is not clear. After the flawless operation of intravascular imaging-based FFR has been demonstrated and these technologies have been incorporated into current software, we foresee wide and rapid clinical adoption. Before any of these techniques can be incorporated into standard therapy, however, additional clinical evidence is required, particularly from randomized and controlled trials, to establish predictive clinical value.
Declaration of patient consent
Patient’s consent not required as there are no patients in this study.
Conflicts of interest
There are no conflicts of interest.
Financial support and sponsorship
Nil.
References
- Measurements of coronary flow reserve: Defining pathophysiology versus making decisions about patient care. Circulation. 1987;76:1183-9.
- [CrossRef] [PubMed] [Google Scholar]
- Revascularization decisions in patients with stable angina and intermediate lesions: Results of the international survey on interventional strategy. Circ Cardiovasc Interv. 2014;7:751-9.
- [CrossRef] [PubMed] [Google Scholar]
- The evolving future of instantaneous wave-free ratio and fractional flow reserve. J Am Coll Cardiol. 2017;70:1379-402.
- [CrossRef] [PubMed] [Google Scholar]
- Fractional flow reserve derived from routine coronary angiograms. J Am Coll Cardiol. 2016;68:2235-7.
- [CrossRef] [PubMed] [Google Scholar]
- Diagnostic performance of angiography-based fractional flow reserve in various subgroups: Report from the FAST-FFR study. EuroIntervention. 2021;17:e294-300.
- [CrossRef] [PubMed] [Google Scholar]
- Accuracy of fractional flow reserve derived from coronary angiography. Circulation. 2019;139:477-84.
- [CrossRef] [PubMed] [Google Scholar]
- Diagnostic performance of angiogram-derived fractional flow reserve: A pooled analysis of 5 prospective cohort studies. JACC Cardiovasc Interv. 2020;13:488-97.
- [CrossRef] [PubMed] [Google Scholar]
- Diagnostic accuracy of fast computational approaches to derive fractional flow reserve from diagnostic coronary angiography: The international multicenter FAVOR pilot study. JACC Cardiovasc Interv. 2016;9:2024-35.
- [CrossRef] [PubMed] [Google Scholar]
- Diagnostic accuracy of angiography-based quantitative flow ratio measurements for online assessment of coronary stenosis. J Am Coll Cardiol. 2017;70:3077-87.
- [CrossRef] [PubMed] [Google Scholar]
- Diagnostic performance of in-procedure angiography-derived quantitative flow reserve compared to pressure-derived fractional flow reserve: The FAVOR II Europe-Japan study. J Am Heart Assoc. 2018;7:e009603.
- [CrossRef] [PubMed] [Google Scholar]
- Evaluation of coronary artery stenosis by quantitative flow ratio during invasive coronary angiography: The WIFI II study (wire-free functional imaging II) Circ Cardiovasc Imaging. 2018;11:e007107.
- [CrossRef] [PubMed] [Google Scholar]
- Quantitative flow ratio identifies nonculprit coronary lesions requiring revascularization in patients with ST-segment-elevation myocardial infarction and multivessel disease. Circ Cardiovasc Interv. 2018;11:e006023.
- [CrossRef] [PubMed] [Google Scholar]
- Clinical relevance and prognostic implications of contrast quantitative flow ratio in patients with coronary artery disease. Int J Cardiol. 2021;325:23-9.
- [CrossRef] [PubMed] [Google Scholar]
- Angiographic quantitative flow ratio-guided coronary intervention (FAVOR III China): A multicentre, randomised, sham-controlled trial. Lancet. 2021;398:2149-59.
- [CrossRef] [PubMed] [Google Scholar]
- Virtual fractional flow reserve from coronary angiography: Modeling the significance of coronary lesions. JACC Cardiovasc Interv. 2013;6:149-57.
- [CrossRef] [PubMed] [Google Scholar]
- "Virtual" (Computed) fractional flow reserve. JACC Cardiovasc Interv. 2015;8:1009-17.
- [CrossRef] [PubMed] [Google Scholar]
- Virtual coronary intervention. JACC Cardiovasc Imaging. 2019;12:865-72.
- [CrossRef] [PubMed] [Google Scholar]
- Validation of a three-dimensional quantitative coronary angiography-based software to calculate fractional flow reserve: The FAST study. EuroIntervention. 2020;16:591-9.
- [CrossRef] [PubMed] [Google Scholar]
- Vessel fractional flow reserve (vFFR) for the assessment of stenosis severity: The FAST II study. EuroIntervention. 2022;17:1498-505.
- [CrossRef] [PubMed] [Google Scholar]
- Accuracy of computational pressure-fluid dynamics applied to coronary angiography to derive fractional flow reserve: FLASH FFR. Cardiovasc Res. 2020;116:1349-56.
- [CrossRef] [PubMed] [Google Scholar]
- Diagnostic accuracy of intravascular ultrasound-derived minimal lumen area compared with fractional flow reserve--meta-analysis: Pooled accuracy of IVUS luminal area versus FFR. Catheter Cardiovasc Interv. 2014;84:377-85.
- [CrossRef] [PubMed] [Google Scholar]
- Stone, intracoronary optical coherence tomography 2018: Current status and future directions. JACC Cardiovasc Interv. 2017;10:2473-87.
- [CrossRef] [PubMed] [Google Scholar]
- Fractional flow reserve in clinical practice: From wire-based invasive measurement to image-based computation. Eur Heart J. 2019;41:3271-9.
- [CrossRef] [PubMed] [Google Scholar]
- Novel indices of coronary physiology: Do we need alternatives to fractional flow reserve? Circ Cardiovasc Interv. 2020;13:e008487.
- [CrossRef] [PubMed] [Google Scholar]
- Diagnostic accuracy of intracoronary optical coherence tomography-derived fractional flow reserve for assessment of coronary stenosis severity. EuroIntervention. 2019;15:189-97.
- [CrossRef] [PubMed] [Google Scholar]
- Diagnostic accuracy and reproducibility of optical flow ratio for functional evaluation of coronary stenosis in a prospective series. Cardiol J. 2020;27:350-61.
- [CrossRef] [PubMed] [Google Scholar]
- Diagnostic performance of intracoronary optical coherence tomography-based versus angiography-based fractional flow reserve for the evaluation of coronary lesions. EuroIntervention. 2020;16:568-76.
- [CrossRef] [PubMed] [Google Scholar]
- Refinenet: Multi-path refinement networks for high-resolution semantic segmentation In: CVPR Computer Vision and Pattern Recognition Conference. New Jersey, United States: IEEE; 2017. p. :5168-77.
- [CrossRef] [Google Scholar]
- A novel method to assess coronary artery bifurcations by OCT: Cut-plane analysis for side-branch ostial assessment from a main-vessel pullback. Eur Heart J Cardiovasc Imaging. 2015;16:177-89.
- [CrossRef] [PubMed] [Google Scholar]
- Fractional flow reserve and coronary bifurcation anatomy: A novel quantitative model to assess and report the stenosis severity of bifurcation lesions. JACC Cardiovasc Interv. 2015;8:564-74.
- [CrossRef] [PubMed] [Google Scholar]
- Optimal diameter of diseased bifurcation: A practical rule for percutaneous coronary intervention. EuroIntervention. 2012;7:1310-6.
- [CrossRef] [PubMed] [Google Scholar]
- Intracoronary optical coherence tomography-derived virtual fractional flow reserve for the assessment of coronary artery disease. Am J Cardiol. 2017;120:1772-9.
- [CrossRef] [PubMed] [Google Scholar]
- Blinded physiological assessment of residual ischemia after successful angiographic percutaneous coronary intervention: The DEFINE PCI Study. JACC Cardiovasc Interv. 2019;12:1991-2001.
- [CrossRef] [PubMed] [Google Scholar]
- The trans-stent FFR gradient: What is its role in contemporary PCI? J Am Coll Cardiol Interv. 2022;15:2203-5.
- [CrossRef] [PubMed] [Google Scholar]
- Functional patterns of coronary disease: Diffuse, focal, and serial lesions. J Am Coll Cardiol Interv. 2022;15:2174-91.
- [CrossRef] [PubMed] [Google Scholar]