

Translate this page into:
Assessment of KILLIP, TIMI and GRACE SCORE in Predicting STEMI Mortality
*Corresponding author: Arulanandhan Ettiyan, Department of Cardiology, Chengalpattu Govt Medical College and Hospital, Chengalpattu, Tamil Nadu, India. dr.arulanandhancyr@gmail.com
-
Received: ,
Accepted: ,
How to cite this article: Ettiyan A, Radhakrishnan K, Sethumadhavan R, Ponnusamy SK. Assessment of KILLIP, TIMI and GRACE SCORE in Predicting STEMI Mortality. Indian J Cardiovasc Dis Women. 2025;10:5-14. doi: 10.25259/IJCDW_21_2024
Abstract
Objectives
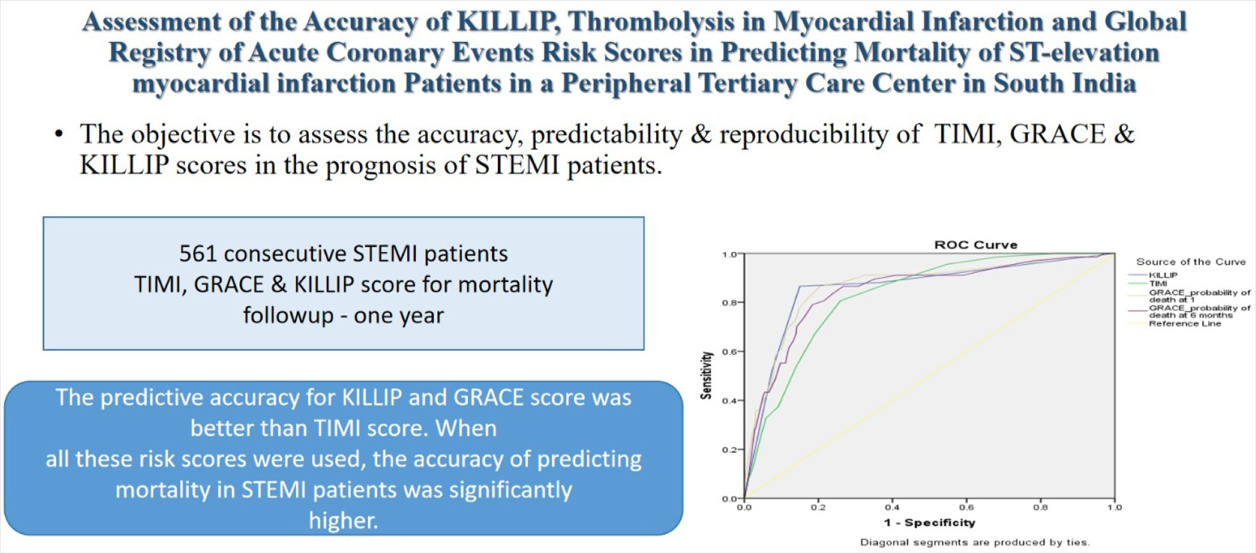
Coronary artery disease is one of the leading causes of death in our country. The incidence of ST-elevation myocardial infarction (STEMI) is 1.34 million. We have scores such as thrombolysis in myocardial infarction ([TIMI], global registry of acute coronary events (GRACE), and KILLIP score to assess the mortality among the STEMI patients. The assessment of accuracy of these scores in predicting mortality in India is lacking. Our aim is to assess the accuracy, predictability, and reproducibility of these scores in the prognosis of STEMI patients.
Materials and Methods
561 consecutive STEMI patients admitted between April 2022 and April 2023 in the cardiac intensive care unit of Chengalpattu Medical College were included in the study. These patients were assessed with TIMI, GRACE, and KILLIP score for mortality and were followed up for 1 year. The outcome of the patients was recorded and the accuracy of the scores in predicting mortality was assessed.
Results
Females comprised 25.13% of the study population and the mean age was 56.93 ± 11.87. Anterior wall myocardial infarction (AWMI) and inferior wall MI were found 58.11% and 41.89%, respectively. The predictive accuracy of these scores was evaluated using Statistics C Area under the curve for TIMI, KILLIP, and GRACE and they were 0.82, 0.85, and 0.86, respectively. The accuracy for diagnosis of TIMI >5, KILLIP >2, and GRACE >167 was 80.68, 88.57, and 83.58%, respectively.
Conclusion
The predictive accuracy for KILLIP and GRACE score was better than TIMI score. When all these risk scores were used, the accuracy of predicting mortality in STEMI patients was significantly higher.
Keywords
ST-elevation myocardial infarction
KILLIP
Global registry of acute coronary events
Thrombolysis in myocardial infarction
Outcome assessment

ABSTRACT IMAGE
INTRODUCTION
In emergency clinics, acute coronary syndrome (ACS) is a common presentation. Electrocardiograms (ECGs) and cardiac marker enzyme levels are used to classify myocardial infarctions (MIs) into three categories: Unstable angina, nonST-elevation MI (NSTEMI), and ST-elevation MI (STEMI). Despite advancements in medical interventions, patients diagnosed with STEMI still encounter significant rates of morbidity and mortality.[1,2] For instance, the in-hospital mortality rates subsequent to primary percutaneous coronary intervention (PPCI) for STEMI patients vary across regions, ranging from 2.5% to 9.4% in Japan, 2.2% to 6.1% in Europe, and 5.7% to 6.3% in the United States.[3-5]
The process of evaluating potential risks was essential to informing the choices made in therapy. Upon risk classification on admission, guidelines urge that high-risk patients have more aggressive invasive therapy.[6-8] Hence, it is imperative to evaluate individual risks in a convenient besides precise method. A number of prognostic scores have been created based on the clinical features of the patients.[9] ACS belongings are commonly seen in emergency departments (EDs). They encompass three distinct types of heart attacks delineated by ECG findings and cardiac marker enzyme levels: “Non-ST-elevation myocardial infarction (NSTEMI), ST-elevation myocardial infarction (STEMI), and unstable angina.” Developed before the widespread adoption of reperfusion, the global registry of acute coronary events (GRACE) and thrombolysis in MI (TIMI) are both prominent models for predictions in ACS. They have primarily been compared directly to the Caucasian population.[10,11] The TIMI risk score was developed using patients who were diagnosed with STEMI and received fibrinolytic therapy. This score is a valuable tool that was produced based on the patients’ experiences. Its purpose is to forecast the likelihood of mortality within 30 days. In addition, studies have discovered that individuals with STEMI who have received PPCI may accurately evaluate the likelihood of in-hospital death using this method.[12] Pollack et al. conducted research that validated the usage of the TIMI risk score in classifying the risk of patients presenting to the emergency room with chest pain syndrome.[13] The TIMI score has shown that it can help doctors decide which invasive procedures to use on people who have been diagnosed with STEMI.[14] A large cohort of persons diagnosed with ACS derived the GRACE risk score, a widely used measure in assessing the risk of acute cardiac events. This is utilized to assess the probability of death while a patient is hospitalized.[15] The European Society of Cardiology (ESC) has officially approved its use for assessing the risk level of persons with NSTEMI.[16] The GRACE risk score demonstrates superior efficacy compared to alternative techniques in forecasting long-term mortality (up to 3 years) in Asian patients who have suffered a heart attack, irrespective of whether it was a STEMI or NSTEMI.[17] Similarly, other study found GRACE to be the most reliable predictor for long-term outcomes in their study.[18] The GRACE score exhibits higher efficacy when compared to more sophisticated techniques such as dobutamine stress echocardiography and cardiac perfusion imaging[19] when it comes to predicting long-term cardiovascular mortality. Considering the GRACE score’s capacity to predict death, it could theoretically be a very useful tool for determining if a patient will need treatment for an angiographic lesion.
Research has demonstrated that TIMI has an advantage due to its simplicity when applied in clinical settings, while GRACE has shown favorable discriminative power.[20,21] The KILLIP classification was designed to evaluate individuals who have experienced an acute MI and categorize them based on the seriousness of cardiac failure following the MI. This approach efficiently classifies both immediate and long-lasting results in persons undergoing acute MI and impacts treatment choices. The purpose of our present study is to scrutinize the consequences of patients who were admitted to a specialist medical center specifically for the treatment of STEMI, a severe type of cardiac attack. Specifically, we will analyze the clinical assessment methods used, including the TIMI score, GRACE score, and KILLIP classification. This study has the potential to generate significant data that can assist in predicting the abiding outlook of persons diagnosed with acute STEMI.
MATERIALS AND METHODS
Study design
This research was carried out in the Department of Cardiology, Government Chengalpattu Medical College and Hospital, with a particular emphasis on patients who were hospitalized to the Intensive Coronary Care Unit as a result of acute MI. The study, conducted from April 2022 to April 2023, had permission from the hospital’s Institute Ethics Committee and closely followed the criteria specified in the 2013 revised edition of the Declaration of Helsinki.
Research setting and subjects
Patients diagnosed with STEMI who arrived at the ED during the specified trial period were deemed eligible for study participation. These people displayed symptoms within 12 h before arriving at the ED and were later treated with thrombolysis.
Exclusion criteria encompassed STEMI patients who did not undergo thrombolysis, those unwilling to participate or provide consent, individuals with comorbid medical conditions potentially influencing mortality, and patients arriving at the ED following out-of-hospital cardiac arrest. Long-term all-cause mortality data were collected through telephone by two separate clinical follow-up fellows.
Data collection and measurement
The starting state and underlying diseases, such as age, renal function, hypertension, weight, diabetes mellitus (DM), and angina pectoris, influence the risk scores under discussion. In addition, ischemia-causing variables such as heart rhythm, hypertension, and the survival of a left bundle branch block (LBBB) or anterior MI also have an impact. Some other factors that are looked at are the KILLIP class, which shows how bad the heart failure (HF) is, the ischemia duration, which shows the state after the left ventricular (LV) ejection fraction, percutaneous coronary intervention (PCI), and the TIMI-3 flow grade. During the time of the presentation, laboratory data and vital signs were gathered, and underlying diseases were identified using information provided by the patients and their medical records.[22,23]
Risk scores and factors
Upon admission, risk scores, including KILLIP class, GRACE, and TIMI, were computed. The TIMI scores comprised the following eight criteria: The age categories are categorized as follows: Individuals below 65 years, individuals between 65 and 75 years, and those above 75 years. The corresponding point values assigned to these age groups are 0, 2, and 3, respectively. Systolic blood pressure (SBP) is <100. Yes is assigned 3 points, no is assigned 0 points, and DM, hypertension, or angina are considered. Yes corresponds to a score of 1 point, while no corresponds to a score of 0 points. Anterior ST elevation, also known as LBBB, is given a score of 1 if it is present and a score of 0 if it is not there. KILLIP class II-V is assigned 2 points for presence and 0 points for absence. A weight of 67 kg is assigned 1 point, whereas a weight of 0 kg is assigned 0 points. We will assign a score of 1 for a time to treatment that exceeds 4 h, and a score of 0 for a time to treatment that falls below 4 h. Cardiac biomarkers indicate a good result.
The KILLIP CLASSIFICATION was created to evaluate individuals who have experienced acute MI and categorize them based on the extent of their HF after the MI. Killip Class I classifies patients who have no apparent clinical manifestations of HF. An S3 gallop, an increased jugular venous pressure, and the presence of crackles or rales in the lungs are characteristics of Killip class II. Patients classified as Killip class III present pronounced signs of acute pulmonary edema. Killip class IV encompasses individuals who are currently experiencing cardiogenic shock or hypotension (with a SBP below 90 mmHg) and exhibit indications of reduced cardiac output, such as decreased urine production, cyanosis, or cognitive impairment.
Upon admission, the patient’s GRACE score was calculated based on their age, heart rate (HR), history of cardiac arrest upon presentation, initial serum creatinine (Cr), SBP, initial positive cardiac enzyme, KILLIP classification, and ST-segment deviation. We utilized online risk calculators in accordance with the 2020 ESC guidelines. The specific calculator we used can be found at the following URL: https://www.outcomesumassmed.org/risk_models_grace_orig.aspx.[24] This method efficiently classifies the long-term and short-term outcomes in patients with acute MI and significantly influences the treatment strategies. The main objectives of clinical evaluation are to evaluate the magnitude of the disease and anticipate the prognosis.
Endpoint
The main outcome measure for this study was the mortality rate of patients during their hospital stay, as well as the rate of readmission due to cardiac causes such as HF, reinfarction, and arrhythmias. In addition, the study also assessed the mortality rate due to cardiac causes during the 6-month follow-up period after discharge.
Analysis of statistics
We presented all fixed variables by utilizing the mean, median, or standard deviation, in addition to an interquartile range of values. The assessment was conducted using either the Mann– Whitney U-test or student’s t-test. The categorical variables were converted into numerical values and percentages, and their comparison was conducted using either the Fisher’s exact test or Chi-squared (χ2) test. To evaluate the effectiveness of risk assessments in distinguishing between different groups, we computed the area under the receiver operating characteristic curve (AUROC).[25] This exemplifies ratings’ accuracy in facilitating diagnoses. We determined statistical significance by setting a P-value threshold of <0.05 and employing the DeLong test to compare the AUROC scores. We conducted the data analysis using IBM Statistical Package for the Social Sciences Statistics version 25 and utilized MedCalc Statistical Software version 19.7.2 to compare the receiver operating characteristic (ROC) curves.
RESULTS
Study group
Out of 675 STEMI patients were admitted during our study period, by applying our inclusion and exclusion criteria, 561 study subjects were selected. Demographic, angiographic, and clinical profile of these study subjects was analyzed, and it follows.
The average age of the patients examined was 56.73 years. Among our study population, 420 (74.87%) were males and 141 (25.13%) were females. Mean SBP is 117.72 ± 21.62 mmHg, mean diastolic blood pressure is 74.82 ± 12.1 mmHg, and mean HR is 88.05 ± 13.98/min. Frequency of anterior wall STEMI was more than inferior wall STEMI (58.11% vs. 41.89%). Echocardiographic shows that 372 (66.31%) patients had mild LV dysfunction, 156 (27.81 %) patients had moderate LV dysfunction, 16 (2.85%) patients had severe LV dysfunction, and 17 (3.03%) patients had normal LV function [Table 1]. Among 561 patients, coronary angiography done for 282 patients, among them single vessel disease is more prevalent 108 patients followed by triple vessel disease 73 patients. Among 282 patients went for PCI, majority patient had percutaneous transluminal coronary angioplasty (PTCA) 109 patient followed by Coronary artery bypass grafting (CABG) 95 patients. 78 patients were treated with optimum medical management [Table 2]. Table 3 displays the risk scores computed by GRACE, KILLIP Class, and TIMI. The median KILLIP class is 1 (1–4), median TIMI score is 4 (0–140, median GRACE points at admission is 142 (14–258), and median GRACE points at 6 month is 113 (11–211). Among our study, 67 (11.94%) patients died due to cardiac cause, 33 (5.88%) patients had readmission due to cardiac cause, and 33 (5.88%) patients died during follow-up [Table 4].
| Sex | Frequency | Percentages |
|---|---|---|
| Female | 141 | 25.13 |
| Male | 420 | 74.87 |
| Sex (%) | Chi-square | P-value | ||
|---|---|---|---|---|
| Female (n=141) | Male (n=420) | |||
| DM | ||||
| No | 109 (77.3) | 347 (82.62) | 1.959 | 0.162 |
| Yes | 32 (22.7) | 73 (17.38) | ||
| SHT | ||||
| No | 119 (84.4) | 353 (84.05) | 0.010 | 0.922 |
| Yes | 22 (15.6) | 67 (15.95) | ||
| Smoking | ||||
| No | 139 (98.58) | 375 (89.29) | 11.884 | <0.001 |
| Yes | 2 (1.42) | 45 (10.71) | ||
DM: Diabetes mellitus, SHT: Subclinical hypothyroidism
| Parameter | Mean±SD | Median | Minimum |
|---|---|---|---|
| KILLIP | 1.79±1.07 | 1.00 | 1.00 |
| TIMI | 4.68±3.06 | 4.00 | 0.00 |
| GRACE points at admission | 147.74±35.84 | 142.00 | 14.00 |
| GRACE points at 6 months | 115.76±31.59 | 113.00 | 11.00 |
TIMI: Thrombolysis in myocardial infarction, GRACE: Global registry of acute coronary events, SD: Standard deviation
| Frequency | Percentage | |
|---|---|---|
| In hospital mortality (death) | ||
| Yes | 67 | 11.94 |
| No | 494 | 88.06 |
| Readmission | ||
| Yes | 33 | 5.88 |
| No | 528 | 94.12 |
| Post-discharge mortality (death) | ||
| Yes | 33 | 5.88 |
| No | 528 | 94.12 |
Characteristic curve analysis of the risk scores
We utilized ROC curves to assess the precision of forecasting in-hospital events by employing TIMI, GRACE risk scores, and KILLIP class. Tables 5-7 and Figure 1 illustrates the predictive importance of the GRACE, KILLIP class, and TIMI risk scores for in-hospital occurrences. However, the GRACE risk scores and KILLIP class had greater predictive capacity than the TIMI risk ratings. There was a notable disparity in the C-statistic values for the GRACE likelihood of death at admission, the GRACE probability of death after 6 months, the KILLIP class, and TIMI. The values were 0.86 (95% confidence interval [CI] 0.81–0.91, P < 0.001), 0.84 (95% CI 0.79–0.89, P < 0.001), 0.85 (95% CI 0.80–0.91, P < 0.001), and 0.82 (95% CI 0.78–0.87, P < 0.001). The GRACE risk score and the KILLIP class showed the utmost accuracy in forecasting mortality in patients STEMI who received PPCI in healthcare facilities.
| In-hospital mortality | Yes (n=67) (%) | No (n=494) (%) | Chi-square | P-value |
|---|---|---|---|---|
| KILLIP | ||||
| >2.5 | 58 (86.57) | 74 (14.98) | 168.038 | <0.001 |
| <2.5 | 9 (13.43) | 420 (85.02) | ||
| TIMI | ||||
| >5.5 | 54 (80.6) | 128 (25.91) | 80.502 | <0.001 |
| <5.5 | 13 (19.4) | 366 (74.09) | ||
| GRACE points at admission | ||||
| >167 | 56 (83.58) | 89 (18.02) | 132.330 | <0.001 |
| <167 | 11 (16.42) | 405 (81.98) | ||
| GRACE points at 6 months | ||||
| >132 | 54 (80.6) | 97 (19.64) | 111.459 | <0.001 |
| <132 | 13 (19.4) | 397 (80.36) |
TIMI: Thrombolysis in myocardial infarction, GRACE: Global registry of acute coronary events
| Readmission | Yes (n=33) (%) | No (n=528) (%) | Chi-square | P-value |
|---|---|---|---|---|
| KILLIP | ||||
| >1.5 | 22 (66.67) | 217 (41.1) | 8.303 | 0.004 |
| <1.5 | 11 (33.33) | 311 (58.9) | ||
| TIMI | ||||
| >4.5 | 19 (57.58) | 220 (41.67) | 3.215 | 0.073 |
| <4.5 | 14 (42.42) | 308 (58.33) | ||
| GRACE points at admission | ||||
| >146.5 | 14 (42.42) | 298 (56.44) | 2.471 | 0.116 |
| <146.5 | 19 (57.58) | 230 (43.56) | ||
| GRACE points at 6 months | ||||
| >116.5 | 20 (60.61) | 228 (43.18) | 3.823 | 0.051 |
| <116.5 | 13 (39.39) | 300 (56.82) |
TIMI: Thrombolysis in myocardial infarction, GRACE: Global registry of acute coronary events
| Post discharge mortality | Yes (n=20) (%) | No (n=541) (%) | Chi-square | P-value |
|---|---|---|---|---|
| KILLIP | ||||
| >1.5 | 13 (65) | 226 (41.77) | 4.255 | 0.039 |
| <1.5 | 7 (35) | 315 (58.23) | ||
| TIMI | ||||
| >4.5 | 12 (60) | 227 (41.96) | 2.567 | 0.109 |
| <4.5 | 8 (40) | 314 (58.04) | ||
| GRACE points at admission | ||||
| >149.5 | 12 (60) | 218 (40.3) | 3.096 | 0.079 |
| <149.5 | 8 (40) | 323 (59.7) | ||
| GRACE points at 6 months | ||||
| >118.5 | 12 (60) | 221 (40.85) | 2.913 | 0.088 |
| <118.5 | 8 (40) | 320 (59.15) |
TIMI: Thrombolysis in myocardial infarction, GRACE: Global registry of acute coronary events
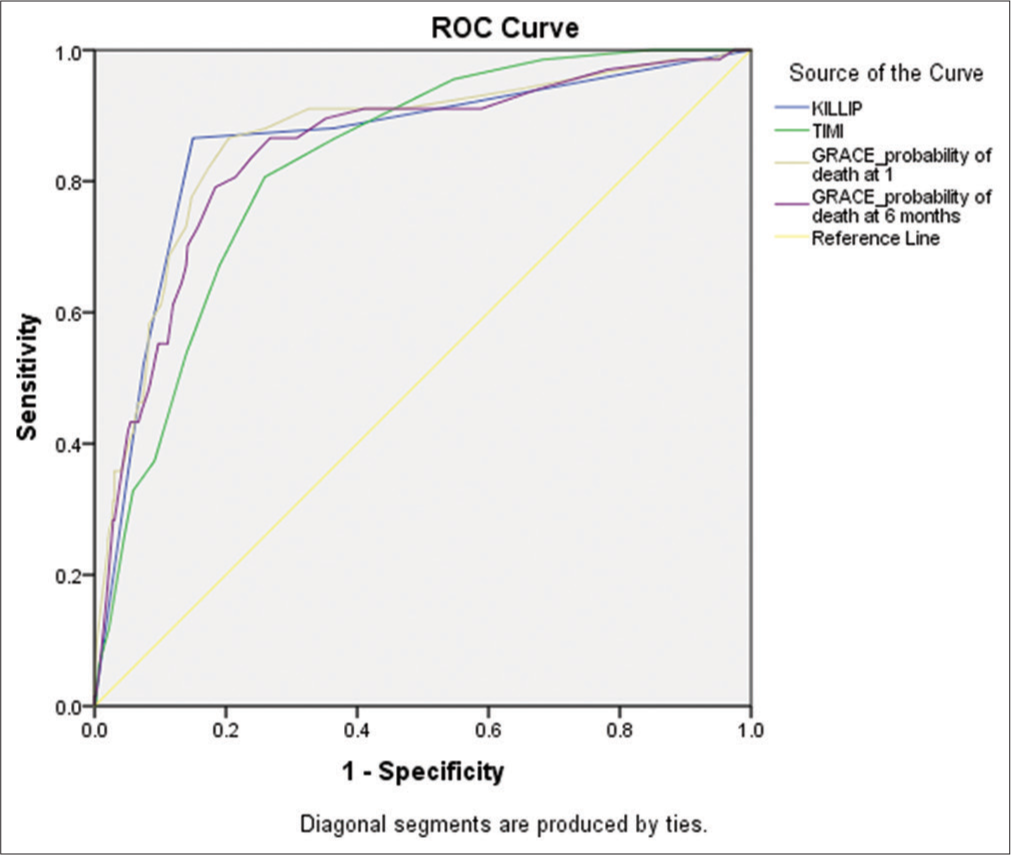
- Receiver operating characteristic (ROC) in hospital mortality.
Figure 2 shows TIMI risk scores, GRACE, KILLIP class had prognostic value for the readmission; however, KILLIP class and GRACE points at 6 months showed better predictive ability than GRACE points at admission TIMI risk scores (C-statistic for GRACE points at 6 months (0.57, 95% CI 0.47– 0.64, P < 0.051), KILLIP class (0.61, 95% CI 0.51–0.70, P < 0.004), GRACE points at admission (0.58, 95% CI 0.48– 0.68, P < 0.116), and TIMI (0.62, 95% CI 0.53–0.71, P < 0.073). Figure 3, shows TIMI risk scores, GRACE, KILLIP class had prognostic value for the post discharge mortality; however, KILLIP class showed smaller increase in predictive ability than GRACE points at admission, GRACE points at 6 months and TIMI risk scores (C-statistic for KILLIP class (0.62, 95% CI 0.53–0.71, P < 0.039), GRACE points at admission (0.58, 95% CI 0.48–0.68, P < 0.079), GRACE points at 6 months (0.57, 95% CI 0.47–0.67, P < 0.088), and TIMI (0.62, 95% CI 0.53–0.71, P < 0.109).
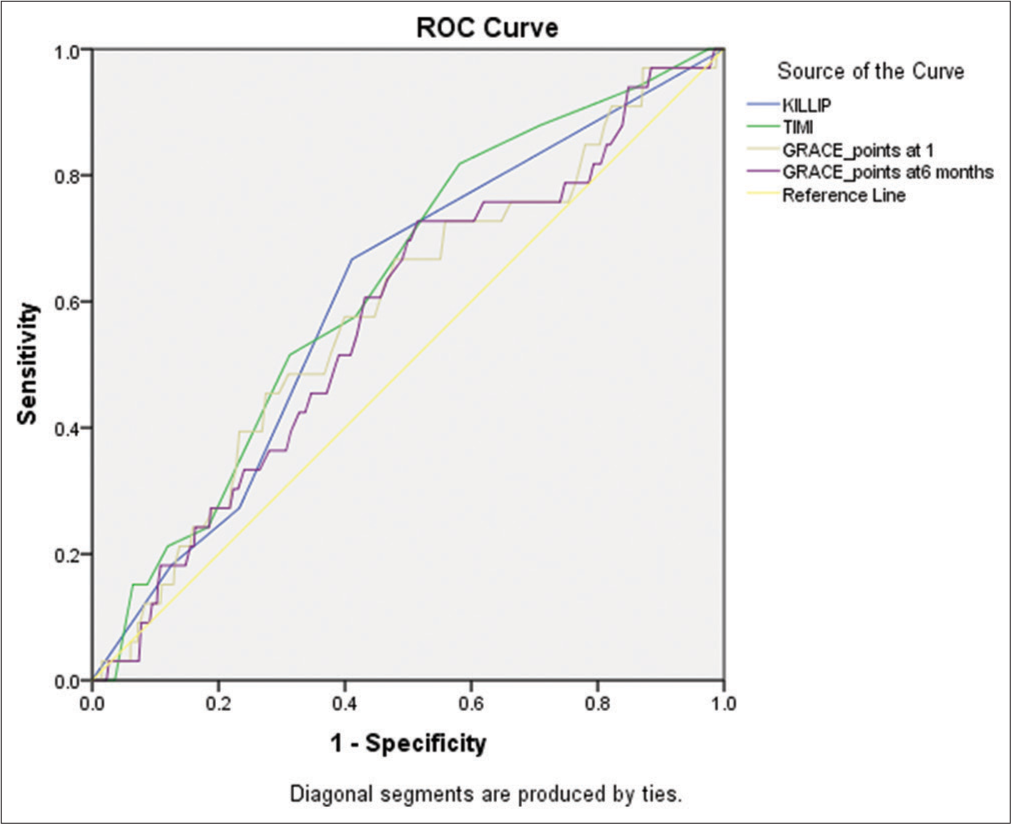
- Receiver operating characteristic (ROC) readmission (n=561). (TIMI: Thrombolysis in myocardial infarction, GRACE: Global registry of acute coronary events.)
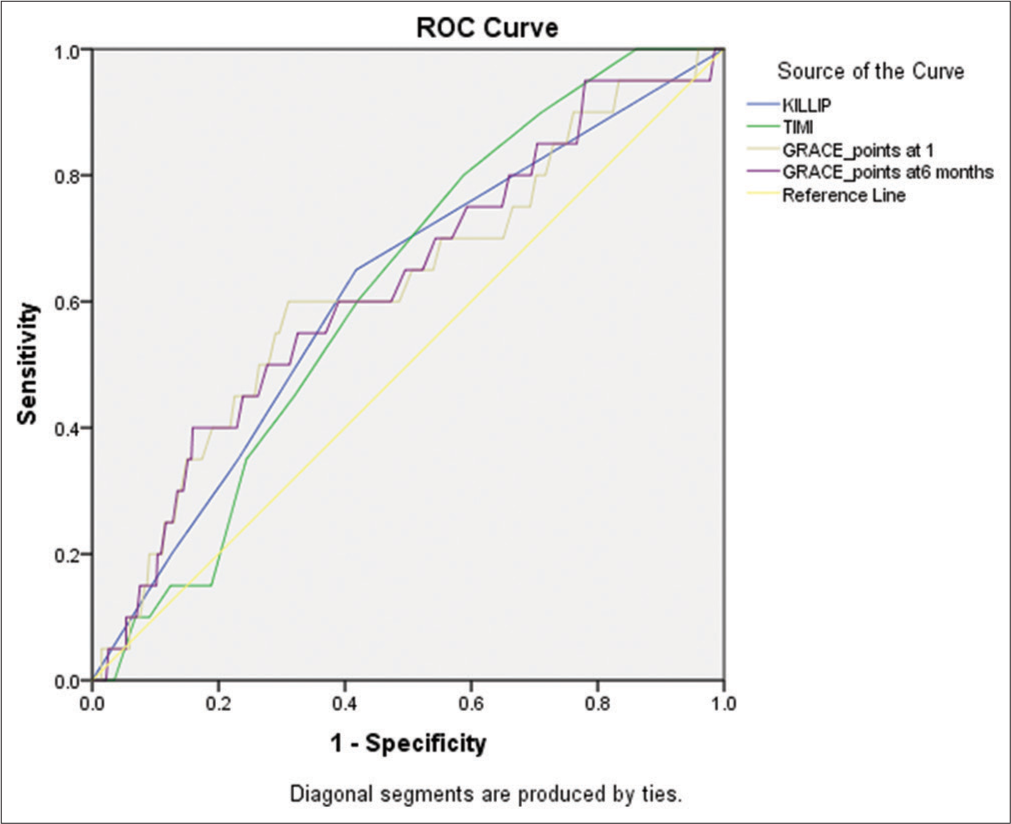
- Receiver operating characteristic (ROC) predicting post-discharge mortality (death) (n=561). (TIMI: Thrombolysis in myocardial infarction, GRACE: Global registry of acute coronary events.)
Sensitivity, specificity, and other parameters predicting validity of KILLIP class, TIMI risk score, GRACE points at admission, GRACE points at 6 months in predicting in readmission, Echo characteristics, hospital mortality, post discharge mortality are in Tables 8-12.[8-12]
| Parameter | KILLIP | TIMI | GRACE points at admission | GRACE points at 6 months | ||||||||
|---|---|---|---|---|---|---|---|---|---|---|---|---|
| Value | 95% CI | Value | 95% CI | Value | 95% CI | Value | 95% CI | |||||
| Lower | Upper | Lower | Upper | Lower | Upper | Lower | Upper | |||||
| Sensitivity (%) | 66.67 | 48.17 | 82.04 | 57.58 | 39.22 | 74.52 | 42.42 | 25.48 | 60.78 | 60.61 | 42.14 | 77.09 |
| Specificity (%) | 58.90 | 54.57 | 63.13 | 58.33 | 54.00 | 62.58 | 43.56 | 39.28 | 47.91 | 56.82 | 52.47 | 61.09 |
| False positive rate (%) | 41.10 | 36.87 | 45.43 | 41.67 | 37.42 | 46.00 | 56.44 | 52.09 | 60.72 | 43.18 | 38.91 | 47.53 |
| False negative rate (%) | 33.33 | 17.96 | 51.83 | 42.42 | 25.48 | 60.78 | 57.58 | 39.22 | 74.52 | 39.39 | 22.91 | 57.86 |
| Positive predictive value (%) | 9.21 | 5.86 | 13.60 | 7.95 | 4.85 | 12.14 | 4.49 | 2.47 | 7.41 | 8.06 | 5.00 | 12.18 |
| Negative predictive value (%) | 96.58 | 93.97 | 98.28 | 95.65 | 92.81 | 97.60 | 92.37 | 88.34 | 95.34 | 95.85 | 93.00 | 97.77 |
| Diagnostic accuracy (%) | 59.36 | 55.16 | 63.45 | 58.29 | 54.08 | 62.41 | 43.49 | 39.35 | 47.71 | 57.04 | 52.83 | 61.18 |
| Positive likelihood ratio | 1.62 | 0.91 | 2.642 | 1.38 | 0.72 | 2.07 | 0.75 | 0.35 | 1.023 | 1.40 | 0.76 | 2.157 |
| Negative likelihood ratio | 0.57 | 0.04 | 0.922 | 0.73 | 0.06 | 1.089 | 1.32 | 0.07 | 1.799 | 0.69 | 0.05 | 1.065 |
TIMI: Thrombolysis in myocardial infarction, GRACE: Global registry of acute coronary events, CI: Confidence interval
| Parameter | KILLIP | TIMI | GRACE points at admission | GRACE points at 6 months | ||||||||
|---|---|---|---|---|---|---|---|---|---|---|---|---|
| Value | 95% CI | Value | 95% CI | Value | 95% CI | Value | 95% CI | |||||
| Lower | Upper | Lower | Upper | Lower | Upper | Lower | Upper | |||||
| Sensitivity (%) | 86.57 | 76.03 | 93.67 | 80.60 | 69.11 | 89.24 | 83.58 | 72.52 | 91.51 | 80.60 | 69.11 | 89.24 |
| Specificity (%) | 85.02 | 81.56 | 88.05 | 74.09 | 69.99 | 77.90 | 81.98 | 78.31 | 85.27 | 80.36 | 76.58 | 83.78 |
| False positive rate (%) | 14.98 | 11.95 | 18.44 | 25.91 | 22.10 | 30.01 | 18.02 | 14.73 | 21.69 | 19.64 | 16.22 | 23.42 |
| False negative rate (%) | 13.43 | 6.33 | 23.97 | 19.40 | 10.76 | 30.89 | 16.42 | 8.49 | 27.48 | 19.40 | 10.76 | 30.89 |
| Positive predictive value (%) | 43.94 | 35.32 | 52.84 | 29.67 | 23.14 | 36.88 | 38.62 | 30.66 | 47.06 | 35.76 | 28.14 | 43.96 |
| Negative predictive value (%) | 97.90 | 96.06 | 99.04 | 96.57 | 94.21 | 98.16 | 97.36 | 95.32 | 98.67 | 96.83 | 94.64 | 98.30 |
| Diagnostic accuracy (%) | 85.20 | 81.99 | 88.04 | 74.87 | 71.06 | 78.41 | 82.17 | 78.75 | 85.25 | 80.39 | 76.86 | 83.60 |
| Positive likelihood ratio | 5.78 | 3.1 | 10.625 | 3.11 | 1.94 | 5.081 | 4.64 | 2.62 | 7.976 | 4.10 | 2.36 | 6.7 |
| Negative likelihood ratio | 0.16 | 0.02 | 0.29 | 0.26 | 0.02 | 0.428 | 0.20 | 0.02 | 0.344 | 0.24 | 0.03 | 0.394 |
TIMI: Thrombolysis in myocardial infarction, GRACE: Global registry of acute coronary events, CI: Confidence interval
| Parameter | KILLIP | TIMI | GRACE points at admission | GRACE points at 6 months | ||||||||
|---|---|---|---|---|---|---|---|---|---|---|---|---|
| Value | 95% CI | Value | 95% CI | Value | 95% CI | Value | 95% CI | |||||
| Lower | Upper | Lower | Upper | Lower | Upper | Lower | Upper | |||||
| Sensitivity (%) | 65.00 | 40.78 | 84.61 | 60.00 | 36.05 | 80.88 | 60.00 | 36.05 | 80.88 | 60.00 | 36.05 | 80.88 |
| Specificity (%) | 58.23 | 53.94 | 62.42 | 58.04 | 53.76 | 62.24 | 59.70 | 55.43 | 63.87 | 59.15 | 54.87 | 63.32 |
| False positive rate (%) | 41.77 | 37.58 | 46.06 | 41.96 | 37.76 | 46.24 | 40.30 | 36.13 | 44.57 | 40.85 | 36.68 | 45.13 |
| False negative rate (%) | 35.00 | 15.39 | 59.22 | 40.00 | 19.12 | 63.95 | 40.00 | 19.12 | 63.95 | 40.00 | 19.12 | 63.95 |
| Positive predictive value (%) | 5.44 | 2.93 | 9.12 | 5.02 | 2.62 | 8.61 | 5.22 | 2.72 | 8.94 | 5.15 | 2.69 | 8.82 |
| Negative predictive value (%) | 97.83 | 95.57 | 99.12 | 97.52 | 95.16 | 98.92 | 97.58 | 95.29 | 98.95 | 97.56 | 95.25 | 98.94 |
| Diagnostic accuracy (%) | 58.47 | 54.26 | 62.58 | 58.11 | 53.90 | 62.23 | 59.71 | 55.52 | 63.80 | 59.18 | 54.98 | 63.28 |
| Positive likelihood ratio | 1.56 | 0.73 | 2.839 | 1.43 | 0.64 | 2.458 | 1.49 | 0.65 | 2.558 | 1.47 | 0.65 | 2.524 |
| Negative likelihood ratio | 0.60 | 0.04 | 1.097 | 0.69 | 0.05 | 1.184 | 0.67 | 0.05 | 1.151 | 0.68 | 0.05 | 1.162 |
TIMI: Thrombolysis in myocardial infarction, GRACE: Global registry of acute coronary events, CI: Confidence interval
| Diagnosis | Frequency | Percentages |
| AWMI | 326 | 58.11 |
| IWMI | 235 | 41.89 |
| Echo | Frequency | Percentages |
| Mild | 372 | 66.31 |
| Moderate | 156 | 27.81 |
| Normal | 17 | 3.03 |
| Severe | 16 | 2.85 |
AWMI: Anterior wall myocardial infarction, IWMI: Inferior wall myocardial infarction
| Descriptive analysis of CAG in the study population | ||
| CAG | Frequency | Percentages |
| DVD | 41 | 7.31 |
| MIN | 56 | 9.98 |
| Not done | 283 | 50.45 |
| SVD | 108 | 19.25 |
| TVD | 73 | 13.01 |
| Descriptive analysis of treatment in the study population | ||
| Treatment | Frequency | Percentages |
| CABG | 91 | 32.27 |
| CABG/OMM | 2 | 0.71 |
| LAD | 2 | 0.71 |
| OMM | 78 | 27.66 |
| PTCA | 100 | 35.46 |
| PTCA to LAD | 1 | 0.35 |
| PTCA to LAD, LCX | 1 | 0.35 |
| PTCA to LAD, RCA | 1 | 0.35 |
| PTCA to LAD, LCX | 1 | 0.35 |
| PTCA to LCX | 5 | 1.77 |
DVD: Double vessel disease, SVD: Single vessel disease, TVD: Triple vessel disease, CAG: Coronary angiogram, MIN: Minimal, OMM: Obtuse marginal artery, LAD: Left anterior descending artery, LCX: Left circumflex coronary artery, RCA: Right coronary artery
DISCUSSION
We evaluated the prognostic effectiveness of the KILLIP Class, TIMI, and GRACE risk scores in predicting the probability of in-hospital mortality in patients diagnosed with STEMI. All three systems have shown exceptional proficiency in their respective functions. Previous research consistently highlights the robust predictive exactness of the GRACE risk score, although Lev et al. observed lower accuracy in predicting 30-day death among STEMI patients treated with PPCI, with a C statistic of 0.471.[17,18,26] In contrast to the GRACE original cohort, our study cohort had significantly higher prevalence rates of hyperlipidemia, ischemia, stroke, hypertension, diabetes, and renal insufficiency.[27] Supporting prior findings, our study confirms the superior predictive capability of the GRACE score over TIMI in forecasting 28-day mortality in NSTEMI cases, with an area under the curve (AUC) of 0.87 versus 0.54.[28]
Moreover, our observations indicate that patients in higher KILLIP classes experienced elevated mortality rates during their hospitalization. In a separate Korean study focusing on NSTEMI patients, the ROC curves for TIMI risk scores and GRACE yielded AUC values of 0.750 and 0.616, respectively, further emphasizing the superior prognostic ability of GRACE.[25] Similarly, the predictive accuracy of KILLIP class surpassed that of the TIMI risk score in forecasting inhospital mortality in our patient cohort. Notably, our findings revealed a slightly lower predicted accuracy for the TIMI risk score compared to other risk scores.
Furthermore, racial disparities significantly impact cardiovascular disease risk, influenced by genetic factors, dietary habits, and lifestyle choices.[29] Disparities in obesity rates, waist-to-hip ratios, dietary preferences (such as the intake of wheat, rice, and fast food), and factors related to lifestyle (such as tobacco use, alcohol consumption, and physical activity) all contribute to these variations, ultimately affecting weight norms across various ethnicities.[30,31]
Individuals who have been diagnosed with STEMI who had higher levels of severity and risk, as evaluated by the KILLIP classification system, had a greater likelihood of mortality within a 30-day period.[18] Anavekar et al. research indicates that even a modest form of kidney disease substantially raises the probability of cardiovascular complications in those who have experienced a heart attack.[32]
A number of investigations have compared different risk ratings to predict death and consequences in STEMI patients receiving PPCI. Nevertheless, these ratings have not exhibited precision in forecasting over an extended period of time.[33-36] This finding supports our research, which indicates that none of the scores are superior in predicting long-term death. Furthermore, it is important for doctors to check if these risk ratings can accurately expect in-hospital death for STEMI patients receiving PPCI, since they were not designed to do that in the first place.
Combining the GRACE and TIMI scores can augment their prognostic value, leading to improved diagnostic accuracy without sacrificing scoring convenience. Several findings shed light on the disparities observed among risk scores. Physicians may hesitate to utilize risk ratings at the patient’s bedside due to perceived inconvenience and time constraints. Furthermore, the majority of patients opt for invasive therapy while in the hospital’s ED. Therefore, integrating the two risk scores maintains scoring simplicity while enhancing diagnostic precision. This amalgamation achieves comparable discriminatory ability to the GRACE score while preserving the user-friendly nature of the TIMI score, enabling more efficient assessment of patients in the emergency room. Ultimately, this approach enhances patient care in routine clinical practice.
Limitations
Our investigation encountered several limitations. Primarily, the research was restricted to a single medical center and featured a partial sample size. Moreover, the study cohort predominantly comprised individuals of Asian ethnicity. In addition, our follow-up period spanned only 6 months, restricting our capacity to evaluate long-term mortality outcomes.
CONCLUSION
The TIMI, KILLIP, and GRACE risk scores exhibit strong predictive capabilities for in-hospital death in patients diagnosed with STEMI. Nevertheless, the GRACE and KILLIP risk assessments demonstrated more precision in predicting in-hospital mortality when compared to the TIMI scores. Before proceeding with risk classification using the GRACE score, doctors may initially employ the KILLIP and TIMI scores for screening purposes. This innovative method simplifies the use of risk scores and enhances the detection of people at high risk.
Ethical approval
The research/study was approved by the Internatioanl Ethics Committee Chengalpattu Medical College, number no. Iec-cmc/approval/19/2023, dated September 14, 2023.
Declaration of patient consent
The authors certify that they have obtained all appropriate patient consent.
Conflicts of interest
There are no conflicts of interest.
Use of artificial intelligence (AI)-assisted technology for manuscript preparation
The authors confirm that there was no use of artificial intelligence (AI)-assisted technology for assisting in the writing or editing of the manuscript and no images were manipulated using AI.
Financial support and sponsorship: Nil.
References
- ESC Guidelines for the Management of Acute Myocardial Infarction in Patients Presenting with ST-Segment Elevation: The Task Force for the Management of Acute Myocardial Infarction in Patients Presenting with ST-segment elevation of the European Society of Cardiology (ESC) Eur Heart J. 2017;39:119-77.
- [Google Scholar]
- Fourth Universal Definition of Myocardial Infarction (2018) Rev Esp Cardiol. 2019;72:72.
- [CrossRef] [PubMed] [Google Scholar]
- Improving Care of STEMI in the United States 2008 to 2012. J Am Heart Assoc. 2019;8:e008096.
- [CrossRef] [PubMed] [Google Scholar]
- In-hospital Mortality among Consecutive Patients with ST-Elevation Myocardial Infarction in Modern Primary Percutaneous Intervention Era Insights from 15-Year Data of single-center Hospital-based Registry. PLoS One. 2021;16:e0252503.
- [CrossRef] [PubMed] [Google Scholar]
- Reperfusion Therapy for ST Elevation Acute Myocardial Infarction 2010/2011: Current Status in 37 ES Ccountries. Eur Heart J. 2014;35:1957-70.
- [CrossRef] [Google Scholar]
- 2015 ESC Guidelines for the Management of Acute Coronary Syndromes in Patients Presenting without Persistent ST-Segment Elevation: Task Force for the Management of Acute Coronary Syndromes in Patients Presenting without Persistent ST Segment Elevation of the European Society of Cardiology (ESC) Eur Heart J. 2016;37:267-315.
- [CrossRef] [PubMed] [Google Scholar]
- An Analysis of Patients Receiving Emergency CAG without PCI and the Value of GRACE Score in Predicting PCI Possibilities in NSTE-ACS Patients. J Geriatr Cardiol. 2015;12:246-50.
- [Google Scholar]
- The TIMI Risk Score for Unstable Angina/non-ST Elevation MI: A Method for Prognostication and Therapeutic Decision Making. JAMA. 2000;284:835-42.
- [CrossRef] [PubMed] [Google Scholar]
- GRACE Risk Score: Sex-based Validity of in-hospital Mortality Prediction in Canadian Patients with Acute Coronary Syndrome. Int J Cardiol. 2017;244:24-9.
- [CrossRef] [PubMed] [Google Scholar]
- TIMI Risk Score for ST-elevation Myocardial Infarction: A Convenient, Bedside, Clinical Score for Risk Assessment at Presentation: An Intravenous nPA for Treatment of Infarcting Myocardium Early II Trial Substudy. Circulation. 2000;102:2031-7.
- [CrossRef] [PubMed] [Google Scholar]
- Application of the TIMI Risk Score for Unstable Angina and non-ST Elevation Acute Coronary Syndrome to an Unselected Emergency Department Chest Pain Population. Acad Emerg Med. 2006;13:13-8.
- [CrossRef] [PubMed] [Google Scholar]
- Can Timi Risk Score Predict Angiographic Involvement in Patients with St-Elevation Myocardial Infarction? ARYA Atheroscler. 2010;6:69-73.
- [Google Scholar]
- Predictors of Hospital Mortality in the Global Registry of Acutecoronary Events. Arch Intern Med. 2003;163:2345-53.
- [CrossRef] [PubMed] [Google Scholar]
- 2020 ESC Guidelines for the Management of Acute Coronary Syndromes in Patients Presenting without Persistent ST-Segment Elevation. Eur Heart J. 2021;42:1289-367.
- [CrossRef] [PubMed] [Google Scholar]
- TIMI and GRACE Risk Scores Predict Both Short-term and Long-Term Outcomes in Chinese Patients with Acute Myocardial Infarction. Acta Cardiol Sin. 2018;34:4-12.
- [Google Scholar]
- GRACE Score among Six Risk Scoring Systems (CADILLAC, PAMI, TIMI, Dynamic IMI, Zwolle) Demonstrated the Best Predictive Value for Prediction of Long-Term Mortality in Patients with ST Elevation Myocardial Infarction. PLoS One. 2015;10:e0123215.
- [CrossRef] [PubMed] [Google Scholar]
- GRACE and TIMI Risk Scores but not Stress Imaging Predict Long-term Cardiovascular Follow-up in Patients with Chest Pain After a Rule-out Protocol. Neth Heart J. 2011;19:324-30.
- [CrossRef] [PubMed] [Google Scholar]
- Use of Risk Scores in Acute Coronary Syndromes. Heart. 2012;98:162-8.
- [CrossRef] [PubMed] [Google Scholar]
- Risk Scores for Risk Stratification in Acute Coronary Syndromes: Useful but Simpler is not Necessarily Better. Eur Heart J. 2007;28:1072-8.
- [CrossRef] [PubMed] [Google Scholar]
- Killip Classification in Patients with Acute Coronary Syndrome: Insight from a Multicenter Registry. Am J Emerg Med. 2012;30:97-103.
- [CrossRef] [PubMed] [Google Scholar]
- TIMI 3 Low After Primary Angioplasty is an Important Predictor for Outcome in Patients with Acute Myocardial Infarction. Clin Res Cardiol. 2009;98:165-70.
- [CrossRef] [PubMed] [Google Scholar]
- 2020 ESC Guidelines for the Management of Acute Coronary Syndromes in Patients Presenting without Persistent ST-Segment Elevation. Eur Heart J. 2021;42:1289-367.
- [CrossRef] [PubMed] [Google Scholar]
- A Method of Comparing the Areas Under Receiver Operating Characteristic Curves Derived from the Same Cases. Radiology. 1983;148:839-43.
- [CrossRef] [PubMed] [Google Scholar]
- Comparison of the Predictive Value of FOUR different Risk Scores for Outcomes of Patients with ST Elevation Acute Myocardial Infarction Undergoing Primary Percutaneous Coronary Intervention. Am J Cardiol. 2008;102:6-11.
- [CrossRef] [PubMed] [Google Scholar]
- Predictors of Hospital Mortality in the Global Registry of Acutecoronary Events. Arch Intern Med. 2003;163:2345-53.
- [CrossRef] [PubMed] [Google Scholar]
- Prognostic Value of Shock Index in Patients Admitted with non-ST-Segment Elevation Myocardial Infarction: The ARIC Study Community Surveillance. Eur Heart J Acute Cardiovasc Care. 2021;10:869-77.
- [CrossRef] [PubMed] [Google Scholar]
- A New Risk Score System for the Assessment of Clinical Outcomes in Patients with non-ST-segment Elevation Myocardial Infarction. Int J Cardiol. 2010;145:450-4.
- [CrossRef] [PubMed] [Google Scholar]
- Dietary Patterns and Cardiovascular Disease Risk among Chinese Adults: A Prospective Cohort Study. Eur J Clin Nutr. 2020;74:1725-35.
- [CrossRef] [PubMed] [Google Scholar]
- Lifestyle Cardiovascular Risk Score, Genetic Risk Score, and Myocardial Infarction in Hispanic/Latino Adults Living in Costa Rica. J Am Heart Assoc. 2016;5:e004067.
- [CrossRef] [PubMed] [Google Scholar]
- Relation between Renal Dysfunction and Cardiovascular Outcomes After Myocardial Infarction. N Engl J Med. 2004;351:1285-95.
- [CrossRef] [PubMed] [Google Scholar]
- Comparison of the Predictive Value of Four different Risk Scores for Outcomes of Patients with ST Elevation Acute Myocardial Infarction Undergoing Primary Percutaneous Coronary Intervention. Am J Cardiol. 2008;102:6-11.
- [CrossRef] [PubMed] [Google Scholar]
- Comparison of the Prognostic Predictive Value of the TIMI, PAMI, CADILLAC, and GRACE Risk Scores in STEACS Undergoing Primary or Rescue PCI. Rev Esp Cardiol. 2012;65:227-33.
- [CrossRef] [Google Scholar]
- GRACE Score among Six Risk Scoring Systems (CADILLAC, PAMI, TIMI, Dynamic IMI, Zwolle) Demonstrated the Best Predictive Value for Prediction of Long-Term Mortality in Patients with ST Elevation Myocardial Infarction. PLoS One. 2015;10:e0123215.
- [CrossRef] [PubMed] [Google Scholar]
- GRACE, TIMI, Zwolle and CADILLAC Risk Scores--do They Predict 5-year Outcomes After ST-Elevation Myocardial Infarction Treated Invasively? Int J Cardiol. 2011;148:70-5.
- [CrossRef] [PubMed] [Google Scholar]