

Translate this page into:
Assessment of Left Ventricular Function using Mitral Annular Plane Systolic Excursion and its Validation with Conventional Methods and Global Longitudinal Strain using Echocardiography in Patients with Coronary Artery Disease
*Corresponding author: Akif Ahamad Baig, Department of Cardiology, Guntur Medical College, Guntur, Andhra Pradesh, India. akifab93@gmail.com
-
Received: ,
Accepted: ,
How to cite this article: Baig AA, Betham R, Srikanth N, Mannuva B, Bose Yannam JC. Assessment of Left Ventricular Function using Mitral Annular Plane Systolic Excursion and its Validation with Conventional Methods and Global Longitudinal Strain using Echocardiography in Patients with Coronary Artery Disease. Indian J Cardiovasc Dis Women. doi: 10.25259/IJCDW_18_2024
Abstract
Objectives
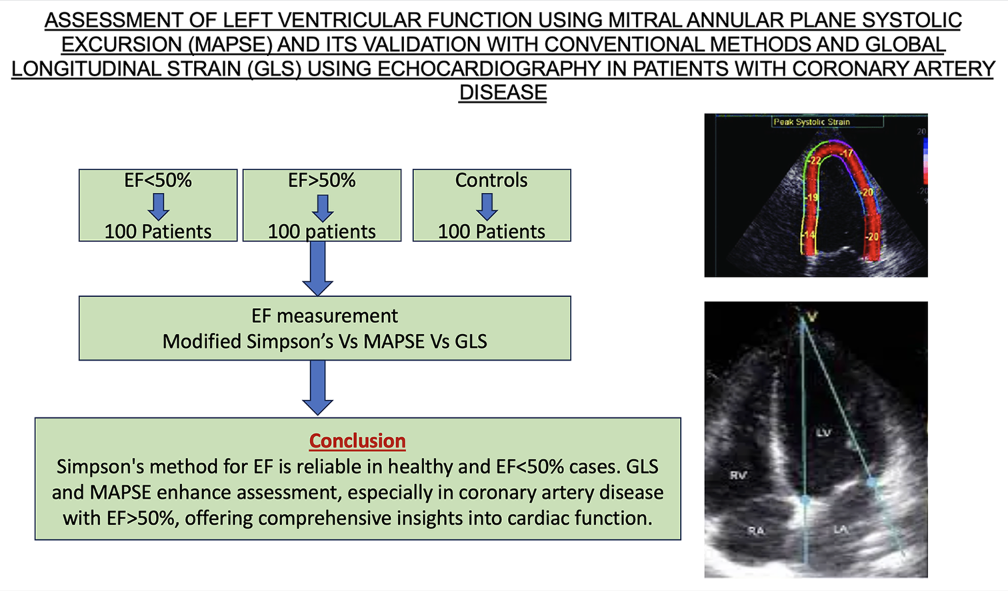
The evaluation of left ventricular (LV) function is crucial in assessing myocardial health, with LV ejection fraction (LVEF) serving as a key metric. For LVEF measurement, two-dimensional echocardiography is frequently used, usually with a modified Simpson’s approach. Alternative methods, such as mitral annular plane systolic excursion (MAPSE) and global longitudinal strain (GLS), provide more information about cardiac function, particularly in difficult clinical situations. This study compares MAPSE and GLS with conventional methods in an effort to determine the efficacy of these measures for assessing LVEF in individuals with coronary artery disease (CAD).
Materials and Methods
The Government General Hospital in Guntur, Andhra Pradesh’s Department of Cardiology conducted this observational and prospective study. There were 300 patients in total, 200 of whom had CAD and 100 of whom were healthy controls. The modified Simpson’s technique had been employed to measure the LVEF, while GLS and MAPSE were used for comparison.
Results
According to baseline characteristics, there are 300 patients in total, including healthy controls and cases with ejection fraction (EF) < 50% and EF > 50%. For patients with EF < 50%, the mean EF as determined by the modified Simpson’s formula was 37.79 ± 5.38, the mean EF as determined by the MAPSE was 37.95 ± 5.32, and the mean EF as determined by the GLS was 38.74 ± 5.42. Using the GLS, MAPSE, or Simpson’s methods to calculate EF did not vary statistically. The mean EF in patients with EF > 50% was 52.31 ± 4.26 using the MAPSE method and 56.24 ± 3.12 using the Simpson method. In individuals with an EF > 50%, there was a statistically significant variation in the EF computation by both of these methods (P < 0.0001). The Simpson approach yielded a mean EF of 56.24 ± 3.12, whereas the GLS method yielded a mean EF of 52.82 ± 4.21. In patients with EF > 50%, there was a statistically significant difference in the EF computation by both of these methods (P < 0.0001). The mean EF estimated using the MAPSE approach was 52.31 ± 4.26, whereas the one using the GLS method was 52.82 ± 4.21. The EF computation revealed no statistically significant variation.
Conclusion
Modified Simpson’s method correlates well with EF calculations using GLS and MAPSE, particularly in healthy individuals and those with EF < 50%. Nevertheless, differences were noted in patients with CAD and EF > 50%. In this subgroup, there was an association between MAPSE and GLS. Integrating GLS and MAPSE alongside traditional methods can enhance cardiac systolic function assessment, particularly in patients with CAD.
Keywords
Mitral annular plane systolic excursion
Global Longitudinal Strain
Ejection fraction
Simpson’s method

ABSTRACT IMAGE
INTRODUCTION
An essential component of evaluating the left ventricle’s systolic function is the evaluation of left ventricular ejection fraction (LVEF). Widely employed, two-dimensional echocardiography (2D-ECHO) emerges as a prevalent modality for quantifying LVEF, enabling multiplane visualization of the left ventricle and furnishing essential structural and functional insights. The determination of LVEF through 2D-ECHO conventionally relies on a modified Simpson’s method, which entails delineating endocardial border across various views and subsequent volume calculations at end-diastole and endsystole.[1]
However, it is imperative to acknowledge that while Simpson’s method offers significant insights, it is not the exclusive parameter for assessing left ventricular (LV) systolic function. Other methods, such as speckle tracking echocardiography, which includes global longitudinal strain (GLS) and mitral annular plane systolic excursion (MAPSE), add more detail on the function of the heart and improve the evaluation of LEVF.[2]
Left atrioventricular plane displacement or MAPSE is an echocardiographic marker that is specific to LV longitudinal function and is different from LVEF. It is obtained from M-mode imaging. Similarly, GLS, a relatively newer technique, offers a comprehensive evaluation of myocardial deformation across multiple planes, potentially expanding the repertoire of approaches for evaluating LV systolic function.[3-5]
Considering these factors into account, we compare and assess the LVEF that is obtained from MAPSE and GLS measurements with the LVEF that is produced using the modified Simpson’s technique. By scrutinizing the correlation and agreement between these measures, our investigation aims to elucidate the reliability and accuracy of MAPSE and GLS as alternative modalities for assessing LV systolic function.
MATERIAL AND METHODS
This is a prospective observational study undertaken at the cardiology department of Government General Hospital in Guntur, Andhra Pradesh, India. 200 subjects and 100 controls make up the 300 participants. The subject group will consist of one hundred patients with ejection fraction (EF) over 50% and one hundred patients with EF below 50%. The control group will comprise 100 healthy relatives without any cardiac diseases.
Patient eligibility
Inclusion criteria
Patients who are at least 18 years old
Patients with a history or current diagnosis of coronary artery disease (CAD).
Exclusion criteria
Suboptimal image quality in echocardiography
Patients experiencing right ventricular failure
Patients with pacemakers, hemodynamic instability, or severe arrhythmias
Patients with significant pericardial effusion
Patients with implanted cardiac defibrillators or pacemakers
Patients with acute heart failure
Patients with a strong history of congenital cardiac disease or valvular heart disease.
Hypertrophic cardiomyopathy patient.
Data collection methods
Clinical histories were used in both the emergency and outpatient departments to identify patients. For participants who fit the inclusion requirements, prospective data were gathered. Every participant provided informed written permission in the format that the Guntur Medical College Institutional Review Board has approved.
2D-ECHO was performed on all patients using a PHILIPS AFFINITY 70 echocardiography machine. Echocardiographic values were obtained in accordance with the most recent guidelines published by the American Society of Echocardiography. GLS, left ventricular ejection fraction (LVEF), and MAPSE are the parameters that will be measured. Speckle echocardiography was performed and GLS was examined using the same echocardiogram machine.
Statistical analysis
Microsoft Excel was employed to capture the data, which included both continuous and discrete variables. For continuous variables, summary statistics such as mean, median, as well as standard deviation, had been employed, whereas frequencies and percentages were used to summarize discrete variables. Normalcy was evaluated by employing the Shapiro–Wilk test. Continuous variables were compared utilizing an unpaired t-test or a Mann–Whitney U-test, depending on normality. Pearson’s correlation coefficient analyzed the relationship between EF measurements. Analysis was done in R Studio, with a significance level of 0.05. Overall, the study employed rigorous statistical methods to ensure robust analysis and interpretation of the data.
RESULTS
There were 300 patients in total, 200 of whom were cases and 100 of whom were controls. Of the 200 cases, 100 had an EF <50% and the other 100 had an EF >50%. The mean age of subjects was 55.1733 ± 9.2615. Overall, 40% were female and 60% were male.
Group A included patients with EF <50%. The study group’s average age was 55.63 ± 9.21. 38% were females and 62% were males. 34 patients in this group were hypertensives and 40 patients were diabetic [Table 1]. The clinical presentation of patients in this group was majorly due to anterior wall myocardial infarction (AWMI) (42%), followed by inferior wall myocardial infarction (IWMI) (29%), non ST elevation myocardial infarction (NSTEMI) (17%) and lateral wall myocardial infarction (LWMI)(9%) [Table 1]. 78 patients were managed with percutaneous transluminal coronary angioplasty (PTCA), 12 underwent coronary artery bypass grafting (CABG), and remaining 10 were on medical management [Table 1].
| Parameter | Group A: (EF<50%) | Group B: EF >50% (100 Patients) | Group C: Controls (100 subjects) |
|---|---|---|---|
| Age (Years) | 55.63±9.21 | 54.79±9.82 | 55.10±8.79 |
| Sex (Females) | 38 | 42 | 40 |
| Hypertension | 34 | 30 | 38 |
| Diabetic | 40 | 41 | 34 |
| Presentation | Not Applicable | ||
| AWMI | 45 | 08 | |
| IWMI | 29 | 28 | |
| LWMI | 09 | 0 | |
| NSTEMI | 17 | 36 | |
| Unstable Angina | 0 | 28 | |
| PTCA | 78 | 74 | Not Applicable |
| CABG | 12 | 12 | Not Applicable |
| Medical Management | 10 | 14 | Not Applicable |
| LVEDV (ml) | 171.17 | 174.63 | 152.98 |
| LVESV (ml) | 107.38 | 76.39 | 54.59 |
| MAPSE (Mean) | 7.43 | 10.628 | 13.38 |
| GLS (Mean) | -9.2937 | -14.237 | -18.43 |
| EF (Simpson) % | 37.79±5.38 | 56.24±3.12 | 64.23±5.21 |
| EF (GLS) % | 38.74±5.42 | 52.82±4.21 | 65.39±4.76 |
| EF (MAPSE) % | 37.95±5.32 | 52.31±4.26 | 64.99±4.85 |
AWMI: Anterior wall myocardial infarction, IWMI: Inferior wall myocardial infarction, LWMI: Lateral wall myocardial infarction, NSTEMI: Non ST elevation myocardial infaction, PTCA: Percutaneous transluminal coronary angioplasty, CABG: Coronary artery bypass grafting, LVEDV: Left ventricular end diastolic volume, LVESV: Left ventricular end systolic volume, MAPSE: Mitral annular presystolic excursion, GLS : Global longitudinal strain, EF: Ejection fraction
Group B included patients with EF > 50%. The study group’s average age was 54.79 ± 9.82. 42% were females and 58% were males [Table 1]. 42 patients in this group were hypertensive and 30 patients were diabetic [Table 1]. The clinical presentation of patients in this group was majorly due to NSTEMI (36%), followed by IWMI (28%), unstable angina (28%), and AWMI (8%) [Table 1]. 74 patients were managed with PTCA, 12 underwent CABG, and remaining 14 were on medical management [Table 1].
Group C included healthy controls with EF > 50%. The mean age of study group was 55.10 ± 8.79. 40% were females and 60% were males [Table 1]. 38 patients in this group were hypertensives and 34 patients were diabetic [Table 1].
The mean left ventricular end diastolic volume (LVEDV) and left ventricular end systolic volume (LVESV) for Group A (patients with EF < 50%) were 171.17 ml and 107.38 mL, correspondingly [Table 1]. The average GLS and MAPSE were −9.29 and 7.43, respectively [Table 1]. Table 2 shows that the mean EF determined by MAPSE was 37.95 ± 5.32, while the mean EF determined using Modified Simpson’s method was 37.79 ± 5.38. EF calculations made by employing the MAPSE approach and Simpson’s method did not differ statistically (P = 0.8293) [Table 2].
| Mean±SD | Median (IQR) | Range | p-value | |
|---|---|---|---|---|
| EF (Simpson) | 37.79±5.38 | 38.10 (33.40 – 42.60) | 24.07 – 46.90 | 0.8293 |
| EF by MAPSE | 37.95±5.32 | 37.80 (34 – 42.30) | 25.96 – 47 | |
| EF (Simpson) | 37.79±5.38 | 38.10 (33.40 – 42.60) | 24.07 – 46.90 | 0.214 |
| EF by GLS | 38.74±5.42 | 39 (35-43) | 25-49 | |
| EF by MAPSE | 37.95±5.32 | 37.80 (34 – 42.30) | 25.96 – 47 | 0.3004 |
| EF by GLS | 38.74±5.42 | 39 (35-43) | 25 – 49 |
EF: Ejection fraction, MAPSE: Mitral annular pre systolic excursion, GLS: Global longitudinal strain
The mean EF assessed using the Modified Simpson’s method was 37.79 ± 5.38, while the mean EF evaluated by GLS was 38.74 ± 5.42 [Table 2]. No statistical difference was observed between the EF calculations using Simpson’s approach and the MAPSE method, P = 0.214.
The average EF as determined by MAPSE was 37.95 ± 5.32, while the average EF as determined by GLS was 38.74 ± 5.42 [Table 2]. EF calculations made by employing the MAPSE approach and Simpson’s approach did not differ statistically (P = 0.3004).
The mean LVEDV and LVESV for Group B (cases with EF > fifty percent) were 174.63 mL and 76.39 mL, correspondingly [Table 1]. The average GLS and MAPSE were –14.23 and 10.628 correspondingly. The mean EF determined by the Simpson approach was 56.24 ± 3.12; however, the MAPSE method yielded a result of 52.31 ± 4.26. In patients with EF > 50%, there was a statistically significant difference in the EF computation by both of these methods (P < 0.0001) [Table 3].
| Mean±SD | Median (IQR) | Range | p-value | |
|---|---|---|---|---|
| EF (Simpson) | 56.24±3.12 | 55.05 (53.85 – 59.45) | 50 – 61.80 | < 0.0001 |
| EF by MAPSE | 52.31±4.26 | 52.40 (49.35 – 54.70) | 45.70 – 61.90 | |
| EF (Simpson) | 56.24±3.12 | 55.05 (53.85 – 59.45) | 50 – 61.80 | <0.0001 |
| EF by GLS | 52.82±4.21 | 52.50 (50-55) | 45 – 63 | |
| EF by MAPSE | 52.31±4.26 | 52.40 (49.35 – 54.70) | 45.70 – 61.90 | 0.1839 |
| EF by GLS | 52.82±4.21 | 52.50 (50-55) | 45 – 63 |
EF: Ejection fraction, MAPSE: Mitral annular plane systolic excursion, GLS: Global longitudinal strain, IQR: Interquartile range
The mean EF estimated using the Simpson approach was 56.24 ± 3.12, whereas the GLS method yielded a result of 52.82 ± 4.21. Patients whose EF was > 50% showed a statistically significant difference in EF computation between the two methods (P < 0.0001) [Table 3].
The mean EF estimated using the MAPSE approach was 52.31 ± 4.26, whereas the one using the GLS method was 52.82 ± 4.21. In patients with an EF >50%, there was no statistically significant difference in the EF calculations employing either approach (P = 0.18839) [Table 3].
The mean LVEDV and LVESV for Group C (Controls) were 152.98 mL and 54.59 mL, correspondingly [Table 1]. The GLS and MAPSE means were, respectively, −18.43 and 13.38. The mean EF calculated using MAPSE was 64.99 ± 4.85 and using Simpson’s technique was 64.23 ± 5.21. Regarding the EF computation, there was no statistically significant difference between the two techniques (P = 0.2812) [Table 4].
| Mean±SD | Median (IQR) | Range | p-value | |
|---|---|---|---|---|
| EF (Simpson) | 64.23±5.21 | 63 (60.20 – 66.90) | 55.50-75 | 0.2812 |
| EF by MAPSE | 64.99±4.85 | 64.30 (61.90 – 68.20) | 54.90-74.90 | |
| EF (Simpson) | 64.23±5.21 | 63 (60.20 – 66.90) | 55.50-75 | 0.1005 |
| EF by GLS | 65.39±4.76 | 65 (62-70) | 57 – 75 | |
| EF by MAPSE | 64.99±4.85 | 64.30 (61.90 – 68.20) | 54.90-74.90 | 0.5613 |
| EF by GLS | 65.39±4.76 | 65 (62-70) | 57 – 75 |
EF: Ejection fraction, MAPSE: Mitral annular plane systolic excursion, GLS: Global longitudinal strain, IQR: Interquartile range
The mean EF computed using Simpson’s technique was 64.23 ± 5.21, and the mean EF calculated using GLS was 65.39 ± 4.76. Regarding the EF computation, no statistically significant difference was seen between the two strategies (P = 0.1005) [Table 4].
The mean EF calculated using GLS was 65.39 ± 4.76 and 64.99 ± 4.85 through MAPSE, respectively. Regarding the EF computation, there was no statistically significant difference among the 2 techniques (P = 0.5613) [Table 4].
DISCUSSION
Our study encompassed a cohort of 300 subjects, consisting of 200 cases and 100 controls. All 200 cases were diagnosed with acute coronary syndrome, with 100 exhibiting EF < 50% and the remaining EF > 50%, as determined by traditional methods like modified Simpson’s. Cases and controls were meticulously matched to ensure comparability.
EF data from MAPSE and GLS and those from the conventional approach (Modified Simpson’s) showed a significant correlation within the control group. Significantly, in the EF calculation among this group of people, there were no statistically significant differences among the 3 approaches.
In the subset of cases with EF < 50%, our analysis revealed no significant disparities in EF calculation when comparing the traditional method (Modified Simpson’s) to computations by employing MAPSE and GLS. This suggests a consistent performance of all three methods in measuring EF within this subgroup of patients.
Conversely, among cases with EF > 50%, substantial statistical differences in EF calculation were noted between the modified Simpson’s method and GLS as well as MAPSE. However, a positive correlation was observed between EF calculation using GLS and MAPSE in this subgroup.
Adel et al.[4] performed a prospective analysis with 170 male patients exhibiting systolic dysfunction. They compared EF measurements obtained through traditional echocardiography techniques with MAPSE-derived EF. Comparing MAPSE and EF using M-mode (r = 0.554), Simpson’s rule (r = 0.585), as well as visual examination (r = 0.611), significant positive associations were discovered. For predicting EF < 30%, a MAPSE cutoff value of ≤5 offered balanced sensitivity (67.1%) as well as specificity (76.5%).
In addition, Khan et al.’s study[6] examined the precision of GLS, Simpson’s biplane mode, and M-mode echocardiography for assessing LVEF in ninety patients. Although GLS outperformed M-mode and Simpson’s mode in terms of accuracy, the difference was not considered statistically significant. Notwithstanding its drawbacks, GLS might provide a better estimate of LVEF, particularly for those with cardiovascular risk factors.
Our study’s unique contribution lies in directly comparing EF calculation with three parameters – modified Simpson’s, MAPSE, and GLS. In addition, we uniquely assessed patients with EF > 50% and CAD, specifically CAD, across three distinct groups.
Our study has very few limitations. First off, because our study only included adults, it is unclear whether the results will hold true for the pediatric population. Second, the effect of diastolic dysfunction on measurements produced from the MAPSE was not examined in our study. Third, only patients with CAD were included in our study. As a result, care should be used when applying our findings to individuals who have congenital or valvular heart disease. Fourth, patients with sinus rhythm who were clinically stable were the focus of our investigation. Patients with pacemakers, arrhythmias, or hemodynamic instability may not be able to use the findings. Fifth, we did not compare the EF produced from MAPSE with other advanced imaging modalities like 3D trans thoracic echocardiography or cardiac MRI.
CONCLUSION
Modified Simpson’s method correlates well with EF calculations using GLS and MAPSE, particularly in healthy individuals and those with EF < 50%, no correlation was observed in CAD patients with EF > 50%. Notably, MAPSE showed a correlation with GLS in this subgroup. Our findings emphasize the importance of integrating GLS and MAPSE measurements alongside traditional methods for comprehensive cardiac systolic function assessment, especially in CAD patients with preserved EF.
Ethical approval
The research/study was approved by the Institutional Review Board at Guntur Medical College, number 167/2021, dated November 11, 2021.
Patient consent declaration
The authors certify that they have obtained all appropriate patient consent.
Conflicts of interest
There are no conflicts of interest.
Use of artificial intelligence (AI)-assisted technology for manuscript preparation
The authors confirm that there was no use of artificial intelligence (AI)-assisted technology for assisting in the writing or editing of the manuscript and no images were manipulated using AI.
Financial support and sponsorship: Nil.
References
- Mitral Annulus Pre-Systolic Excursion (MAPSE) Versus Modified Simpson's Method for Ejection Fraction Estimation in Patients with Acute Coronary Syndrome. Indian J Cardiovasc Dis Women. 2024;9:74-80.
- [CrossRef] [Google Scholar]
- Echocardiographic Assessment of Left Ventricular Systolic Function: An Overview of Contemporary Techniques, Including Speckle-tracking Echocardiography. Mayo Clin Proc. 2019;94:125-38.
- [CrossRef] [PubMed] [Google Scholar]
- Mitral Annular Plane Systolic Excursion as a Surrogate for Left Ventricular Ejection Fraction. J Am Soc Echocardiogr. 2012;25:969-74.
- [CrossRef] [PubMed] [Google Scholar]
- Mitral Annular Plane Systolic Excursion-Derived Ejection Fraction: A Simple and Valid Tool in Adult Males With Left Ventricular Systolic Dysfunction. Echocardiography. 2016;33:179-84.
- [CrossRef] [PubMed] [Google Scholar]
- Correlation of Mitral Annular Plane Systolic Excursion (MAPSE) and Tissue Doppler peak Systolic Velocity with Left Ventricular Systolic Function. J Cardiol Curr Res. 2017;10:349.
- [CrossRef] [Google Scholar]
- Comparison of Various Techniques for Left Ventricular Ejection Fraction. Pak J Med Health Sci. 2022;16:817-9.
- [CrossRef] [Google Scholar]