

Translate this page into:
Estimation of Cardiovascular Risk Profile among Diabetic Patients Attending Tertiary Care Hospital
Sudha Bala, MD Flat No-301, Hno-2-2-1075/A, Shubodaya Enclave, Baghamberpet, Hyderabad, Telangana 500013 India dr.sudhabala78@gmail.com
This article was originally published by Thieme Medical and Scientific Publishers Pvt. Ltd. and was migrated to Scientific Scholar after the change of Publisher.
Abstract

Background Association of type-2 diabetes mellitus with cardiovascular morbidity and mortality is a well-known fact. The measurement of associated risk factors among diabetics gives a better idea for further management and prevention of complications, especially among those with high risk.
Objectives The objective of our study was to compare the cardiovascular risk profile and estimate the 10-year cardiovascular risk using the World Health Organization (WHO) risk chart among diabetic patients as per their gender.
Methods Hospital-based cross-sectional study was undertaken among type 2 diabetic patients attending our tertiary care hospital using a semi-structured questionnaire based on WHO-STEPwise approach to surveillance questionnaire consisting of socio-demographic variables, personal habits, and lifestyle (physical and biochemical measurements). Carotid intima–media thickness (CIMT) was assessed through ultrasonography. Ten-year cardiovascular disease (CVD) risk assessment was also done using WHO/International Society of Hypertension (ISH) charts.
Results One hundred and thirteen male and 144 female subjects were included in the study. On comparison of cardiovascular risk factors, a statistically significant difference among males and females was found in tobacco and alcohol consumption, systolic blood pressure (BP), diastolic BP, and high-density lipoprotein (HDL). CIMT measurements revealed statistically significant differences, with males being significantly at higher risk. A 10-year CVD risk assessment revealed higher risk among males and was statistically significant. It was found that a significant association between increased 10-year CVD risk and HbA1c, HDL, systolic BP, diastolic BP, and CIMT existed.
Conclusions Comparison within gender among diabetic patients revealed that the cardiovascular risk factors were statistically higher among males as per 10-year risk assessment using the WHO/ISH chart.
Keywords
Cardiovascular risk profile
CVD Risk Charts
Carotid intima-media thickness

Introduction
Type-2 diabetes mellitus (T2DM), a non-communicable disease, is characterized by elevated blood glucose, insulin resistance, and relative lack of insulin. Patients with diabetes mellitus who have uncontrolled blood glucose levels in combination with other metabolic derangements are vulnerable to the progression of impairment and lethal complications such as microvascular changes which include retinopathy, nephropathy, neuropathy, and macrovascular changes like atherosclerosis paramount to an increased risk of cardiovascular diseases (CVD) by two- to four-folds.1
Reduction in life expectancy is 10 years, and the single most important determinant of loss of life among type 2 diabetics is CVD. People with T2DM are immensely affected by CVD in comparison to the non-diabetic subjects. The death rates among diabetic patients were reported as 15.4% for those with no preceding myocardial infarction (MI) and 42.0% for patients with the previous history of MI. Contrary to this, in patients without T2DM, cardiovascular death causes were less than 2.1 and 15.9%, respectively.2
CVD patients in India have an average age of approximately 10 less years than those in the Western world, with a higher proportion experiencing MI and poorer outcomes.3 As per evidence-based medicine, there has been an emphasis on combined management of CVD and T2DM with a greater focus on glycemic control. The most prudent way to prevent macrovascular complications is through the risk factor reduction of—glycemic control, smoking cessation, diet, exercise, aggressive blood pressure (BP) control, and treatment of dyslipidemia.4
Associations between risk factors and disease outcomes are equivalent in women and men due to the lack of gender-specific data from epidemiological studies. However, the evidence to support the existence of clinically meaningful gender differences in the relationships between certain risk factors, such as smoking and diabetes, exists. These gender differences associations not only have an influence on patient management and treatment but also have an influence on efforts to quantify the burden of disease due to specific risk factors, as most such studies use only a single estimate of risk that is uniformly applied to both men and women.5
Atherosclerosis has been found to be a significant cause of death, and it presents as a fatal cardiovascular or cerebrovascular event frequently, making it an important factor for its detection in subclinical stages. The most widely used to predict CVD for the subsequent 10 years of an individual is the World Health Organization (WHO)/International Society of Hypertension (ISH) chart.6 The present study targets patients with T2DM to compare the cardiovascular risk profile and estimate the 10-year cardiovascular risk using the WHO risk chart according to their gender.
Materials and Methods
This cross-sectional study was conducted at the Department of Endocrinology, ESIC Medical College and Hospital. A group of 257 patients, both male and female, with T2DM, aged above 40 years with an onset duration of over 1 year were included. T1DM subjects, gestational diabetes, already known cases of coronary artery disease/stroke, and those unwilling to participate were excluded from the study.
A detailed medical history of the subjects was obtained by means of a questionnaire to estimate the cardiovascular risk. It consisted of questions based on WHO-STEPwise approach to surveillance questionnaire subdivided as sociodemographic, behavioral, physical, and biochemical measurements, having socio-demographic variables, personal habits such as tobacco and alcohol consumption, lifestyle, and anthropometric measurements taken to measure height and weight. Height was measured using a stadiometer using standard protocols to the nearest 0.5 cm, and weight was measured using the portable weighing machine to the nearest 0.1 kg. Based on this, body mass index (BMI) (kg/m2) = weight (in kg)/height2 (m2) was calculated as per WHO (Asians) criteria.7 Waist circumference measurement was taken as per the standard procedure at the midpoint between the lower part of the last rib and the top of the hip. A value of >90 cm for males and >80 cm for females was taken as higher range.8
BP was determined using the standardized procedure to document systolic and diastolic BP. Blood samples were taken from the eligible participants to perform biochemical parameters—lipid profile after an overnight fast of 10 to 12 hours using the Cobas C 311 autoanalyzer incorporating the colorimetric principle by collecting 3 mL of blood in plain containers. HbA1c was measured using a whole blood ethylenediaminetetraacetic acid sample and estimated by high-performance liquid chromatography.
|
Total cholesterol |
>200 mg/dL |
|
Triglycerides |
>150 mg/dL |
|
LDL |
>100 mg/dL |
|
HDL |
<40mg/dl for males and <50 mg/dl for females |
|
VLDL |
>30 mg/dL |
|
HbA1C |
>7% |
Biochemical parameters at risk values
Carotid intima–media thickness (CIMT) measurement was performed following the standard protocol.9 Distal common carotid artery was imaged on both sides with a 7.5 MHz linear array transducer, attached to the DC 60 model of Mindray company. The WHO/ISH risk calculation tool was used to estimate the 10 years risk and was color coded as green (<5%), yellow (5– < 10%), orange (10– < 20%), red (20– < 30%), and deep red (>30%).10
Ethical Considerations
Institutional ethical committee approval with number ESICMC/SNR/IEC-S0110/05-2021 was obtained, and written informed consent from the participants was obtained. Data were entered in Microsoft Excel 2018 version. Descriptive variables such as percentages and mean + standard deviation were calculated; chi-square test was performed to assess the association between gender and various cardiovascular risk factors, and the relation between WHO 10-year CVD risk assessment with cardiovascular risk factors was evaluated. A p-value of <0.05 was considered significant.
Results
A total of 257 study subjects were recruited from the age group 40 to 72 years, of which 113 were male and 144 were female. The subjects were chosen from the Out-Patient Block, Department of Endocrinology, ESIC Hospital, Hyderabad. The distribution of frequency of males and females was 44 and 56%, respectively.
Comparison of the Cardiovascular Risk Profile among Diabetic Patients According to Their Gender
Socio-Demographic Variables
The mean age of males was found to be 51.23 ± 6.694 years and females 49.51 ± 6.744 years. Mean years of schooling for males were 8.62 ± 5.751 years, while for females 5.67 ± 5.667 years were found to be the mean years. Both socio-demographic variables were found to be statistically insignificant.
Behavioral Risk Factors
Tobacco products consumption and alcohol usage variables were found to be statistically significant among males compared with females (Figs. 1 and 2)

-
Fig. 1 The tobacco usage in our sample set and its prevalence among males and females in each category. Chi-square test = 29.019, df-2, p-value = 0.0001.
Fig. 1 The tobacco usage in our sample set and its prevalence among males and females in each category. Chi-square test = 29.019, df-2, p-value = 0.0001.
-
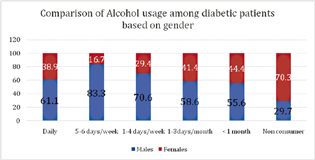
Fig. 2 The alcohol consumption frequency in our sample set and its prevalence in males and females in each category. Chi-square test = 31.132, df-2, p-value = 0.0002.
Fig. 2 The alcohol consumption frequency in our sample set and its prevalence in males and females in each category. Chi-square test = 31.132, df-2, p-value = 0.0002.
In independent t-test, no statistical significant mean scores of number of days of fruits consumed per week (males: 2.17 ± 1.837 days/females: 2.99 ± 2.01 days; p-value = 0.253) were found; similarly, mean scores for number of days of vegetables consumed per week (males: 5.96 ± 0.93 days/females: 6.28 ± 1.042 days; p-value = 0.374) were found which was not a significant factor. Lifestyle (males: sedentary 41[39.3%]; females: 83[60.7%]/active-males 72[47.1%]; females 81[52.9%]) and physical activity were also found to be insignificant on comparison.
Physical Measurements Risk Factors
Comparison of mean scores of physical measurements such as high systolic and diastolic BP with low HDL was statistically significant among males. Other measurements are detailed in Table 1.
|
Physical measurements |
Males |
Females |
p-Value |
|---|---|---|---|
|
Body mass index |
27.816 ± 4.3697 |
26.779 ± 4.2283 |
0.673 |
|
Waist circumference |
88.75 ± 9.248 |
85.97 ± 10.838 |
0.139 |
|
Systolic blood pressure |
130.8 ± 15.68 |
128.56 ± 17.198 |
0.037 |
|
Diastolic blood pressure |
82.66 ± 7.145 |
82.03 ± 9.904 |
0.005 |
|
Total cholesterol mg/dL |
173.67 ± 37.29 |
176.01 ± 36.625 |
0.517 |
|
Triglycerides mg/dL |
148.88 ± 68.526 |
148.83 ± 65.474 |
0.81 |
|
HDL mg/dL |
40.85 ± 7.143 |
44.14 ± 10.06 |
0.006 |
|
LDL mg/dL |
102.1 ± 34.333 |
100.03 ± 33.238 |
0.48 |
|
HbA1C |
7.478 ± 1.4476 |
7.151 ± 1.2288 |
0.214 |
|
VLDL mg/dL |
28.42 ± 11.402 |
28.56 ± 11.952 |
0.843 |
Abbreviations: HDL, high-density lipoprotein; LDL, low-density lipoprotein; VLDL, very-low-density lipoprotein.
Measurement of CIMT to Predict the Risk of CVD According to Their Gender
Left-sided and right-sided measurements of CIMT revealed a statistically significant rise above the normal cut-off of 0.7 mm among males (Table 2).
|
CIMT (mm) |
Males (n = 113) |
Females (n = 144) |
p-Value |
|---|---|---|---|
|
Left sided |
0.805 ± 0.373 |
0.661 ± 0.304 |
0.001 |
|
Right sided |
0.827 ± 0.349 |
0.669 ± 0.288 |
0.001 |
Abbreviation: CIMT, carotid intima–medial thickness.
Estimating the 10 Year Cardiovascular Risk Using the WHO/ISH Risk Chart among Male and Female Diabetic Patients
Using the updated WHO/ISH risk chart, the risk is color coded as green (<5%), yellow (5– < 10%), orange (10– < 20%), red (20– < 30%), and deep red (>30%). Higher risk was found to be more among males, and it was statistically significant with p-value = 0.004 (Fig. 3).

-
Fig. 3 Gender-wise estimation of cardiovascular risk using the WHO CVD risk chart among diabetic patients.
Fig. 3 Gender-wise estimation of cardiovascular risk using the WHO CVD risk chart among diabetic patients.
Waist circumference of greater than 80 cm in females and greater than 90 cm in males was taken as abnormal values for calculation as per WHO criteria; HDL values of below 40 mg/dL in males and below 50 mg/dL in females were considered as low HDL, and total cholesterol >200 mg/dL as abnormal according to National cholesterol education program expert panel11; Hb1AC >7% was considered high range. There was a statistically significant higher CVD Risk with high waist circumference, HbA1C, high total Cholesterol, Low HDL and high CIMT (Table 3).
|
Risk factors |
<5% risk |
5 − < 10% |
10 − < 20% |
20 − < 30% |
>30% |
Chi square |
p-Value |
|---|---|---|---|---|---|---|---|
|
Waist circumference |
|||||||
|
Males >90 cm |
11(23%) |
4(11.4%) |
20(48.7%) |
6(75%) |
0(0%) |
20.72 |
0.00012 |
|
Females >80 cm |
36(77%) |
31(88.6%) |
21(51.3%) |
2(25%) |
0(0%) |
||
|
Duration of diabetes |
|||||||
|
Males |
|||||||
|
<5 y |
27(87%) |
21(66.7%) |
29(74%) |
8(80%) |
0(0%) |
||
|
5–10 y |
2(6.5%) |
11(33%) |
8(21%) |
1(10%) |
0(0%) |
||
|
>10 y |
2(6.5%) |
1(0.3%) |
2(5%) |
1(10%) |
0(0%) |
||
|
Females |
29.71 |
0.012 |
|||||
|
<5 y |
47(82%) |
46(92%) |
24(69%) |
2(100%) |
0(0%) |
||
|
5–10 y |
8(14%) |
3(6%) |
10(28%) |
0(0%) |
0(0%) |
||
|
>10 y |
2(4%) |
1(2%) |
1(3%) |
0(0%) |
0(0%) |
||
|
HbA1C >7% |
|||||||
|
Males |
4(13.3%) |
17(56%) |
25(61%) |
6(100%) |
0(0%) |
||
|
Females |
26(86.7%) |
13(44%) |
16(39%) |
0(0%) |
0(0%) |
24.58 |
0.000018 |
|
Total cholesterol |
|||||||
|
>200 mg/dL |
|||||||
|
Males |
1(6%) |
5(36%) |
16(61%) |
7(87%) |
0(0%) |
18.88 |
0.0002 |
|
Females |
15(94%) |
9(64%) |
10(39%) |
1(13%) |
0(0%) |
||
|
Low HDL |
|||||||
|
Males <40 mg/dL |
14(25%) |
14(27.4%) |
22(48%) |
2(66.6%) |
0(0%) |
8.912 |
0.03 |
|
Females <50 mg/dL |
42(75%) |
37(72.6%) |
23(52%) |
1(33.4%) |
0(0%) |
||
|
Left CIMT >0.7 mm |
|||||||
|
Males |
6(21%) |
22(52%) |
25(61%) |
7(87%) |
0(0%) |
15.756 |
0.0013 |
|
Females |
22(79%) |
20(48%) |
16(39%) |
1(13%) |
0(0%) |
||
|
Right CIMT >0.7 mm |
|||||||
|
Males |
8(23%) |
24(56%) |
31(67%) |
7(87%) |
0(0%) |
||
|
Females |
26(77%) |
19(44%) |
15(33%) |
1(13%) |
0(0%) |
19.65 |
0.002 |
Abbreviations: CIMT, carotid intima–medial thickness; HDL, high-density lipoprotein; WHO/ISH, World Health Organization/International Society of Hypertension.
The menopausal status also acted as a statistically significant risk factor among women where the higher risk estimate of CVD was associated with the attainment of menopause (Table 4)
|
Menopause |
<5% |
5 − < 10% |
10 − < 20% |
20 − < 30% |
>30% |
Chi square |
p-Value |
|---|---|---|---|---|---|---|---|
|
Present |
4(9.5%) |
16(38%) |
18(42.8%) |
4(9.5%) |
0(0%) |
0.0001 |
|
|
Absent |
50(49%) |
33(32.3%) |
17(16.6%) |
1(2.1%) |
0(0%) |
31.654 |
Abbreviation: WHO/ISH, World Health Organization/International Society of Hypertension.
Discussion Comparison of the Cardiovascular Risk Profile among Diabetic Patients According to Their Gender
This study was performed to compare the cardiovascular risk profile of diabetic patients according to their gender. Diabetes, due to its prevalence and complications, makes a significant impact on overall morbidity and is a cause of CVD-related risk factors. Data on socio-demographic, behavioral, physical, and biochemical factors having a bearing on the CVD risk were collected and statistically analyzed in 257 subjects, of which 113 were male and 144 were female.
The study showed a higher prevalence of cardiovascular risk factors in people with T2DM. Among the risk factors, this study revealed that there was a gender-wise difference in risk factors such as systolic BP and diastolic BP and alcohol and tobacco consumption being higher in men compared with women. Similarly, HDL, the good cholesterol, was found to be lower in men compared with women. The average mean value SBP was 130.8 ± 15.68 for males and 128.56 ± 17.198 mm Hg for females, whereas for diastolic BP, the average mean value was 82.66 ± 7.145 mm Hg for males and 82.03 ± 9.904 mm Hg.
A research study by Penn et al of 15,773 consecutive Caucasian patients with type 2 diabetes attending 19 hospital-based diabetes clinics of the National Health Service throughout Italy found CVD to be prevalent among men. However, women showed a less favorable CVD risk profile and a poor performance in achieving targets for hemoglobin A1c, LDL, HDL and non-HDL cholesterol, systolic BP, and, in particular, obesity (BMI and waist circumference), except for triglycerides and diastolic BP, thereby suggesting that factors other than gender disparities in treatment intensity are responsible.12
A study on CVD risk assessment and treatment among persons with T2DM at the primary care level in rural central India by Gaidhane et al reported significant gender differences similar to the present study for tobacco and alcohol consumption and diastolic BP. However, unlike in the present study, waist circumference was a significant factor for CVD risk estimation.13
Research conducted on cardiovascular risk factors in patients with type 2 diabetes with special reference to gender concluded that there is a distinct gender-based risk clustering of obesity, poor glycemic control, hypertension, and dyslipidemia with lower levels of smoking and alcohol consumption among women. Men were reported to have obesity (84%), poor glycemic control (32%), hypertension (34%), dyslipidemia (20%), smoking (61%), and consumption of alcohol (52%). Women had a higher prevalence of poor glycemic control (40 vs. 30%) and dyslipidemia (30 vs. 17.5%). There was no gender difference with regard to the prevalence of hypertension.14
Several studies have demonstrated cardiovascular risk and mortality to be higher among females. Supporting this systematic analysis by Huxley et al in their 37 prospective cohort studies found that the relative risk for fatal coronary artery disease associated with diabetes was 50% higher among women compared with men. This was explained by more adverse cardiovascular risk profiles among women with diabetes combined with possible disparities in treatment that favor men. The same author in another study among type 1 diabetics found that women have 40% greater risk of all-cause mortality and twice the exuberance risk of fatal and nonfatal vascular events compared with men.15 16
Peters et al reported that females with diabetes have greater than 40% risk of incident coronary heart disease compared with males in their meta-analysis of cohort studies but could not explain the actual reasons for this and stressed on further studies to be undertaken to find the mechanisms responsible for this disparity.17
These differences could be due to variations in the ethnicity, settings, and various lifestyles adopted in different regions and gender-specific factors.
Estimating the 10-Year Cardiovascular Risk Using the WHO/ISH Risk Chart among Male and Female Diabetic Patients
The CVD risk charts of 2007 WHO/ISH were updated by WHO in 2019, through the formation of a cross-sector collaboration of academicians, policy-makers, and end-users of CVD risk scores. The updated WHO CVD risk prediction charts were evolved and presented as 21 global regions defined by Global Burden of Disease (GBD) so as to maximize region variability and minimize heterogeneity in mortality and major drivers of health outcomes within each region. The charts allow the initiation of a total risk-stratification approach for the management of CVD. They are conferred as laboratory-based and non-laboratory-based charts. Laboratory-based algorithms include information on sociodemographic variables, systolic BP, history of diabetes mellitus, and the total cholesterol levels, whereas non-laboratory-based algorithms include the BMI without the requirement of biochemical parameters.18
Risk-based CVD management countries can find the charts relevant to them according to the appropriate GBD regional groups. India falls under the South Asia group. The laboratory-based CVD risk charts should be used for treatment decisions. This is the indicated risk chart in a setting where laboratory facilities, human, and financial resources are accessible.
In our present study, it was found that there was a statistically significant variation between risk percentage among males and females, with males being greater than females. More than five percent risk was seen in 34% of the subjects of which 34.2% were male and 64.8% were female. Thirty-two percent of the subjects were categorized between 5 and <10% of which 39.8% were male and 60.2%. For the risk score between 10 and <20%, a total of 29% were categorized of which 52.7% were male and 47.3% were female. In the category of 20 and <30%, the total subject population was 5% of which 83.3% were males and 16.7% were females. A risk of ≥30% was not seen in the sample population. Increased CVD risk was also statistically significantly higher among males with increased waist circumference, duration of diabetes, Hba1c, CIMT, total cholesterol, and low HDL, though menopausal women had increased risk as per WHO/ISH prediction categories.
A study conducted in Bangladesh by Islam et al revealed more than three-fourths (85%) of the participants had low risk and 64% had very low risk, and this proportion was statistically significant with gender (p < 0.001). About 99.5% of the study population were categorized as having cardiovascular risk <20%. Comprehensively, only one male participant was categorized as having a very high risk of ≥30%.19
In line with the above study, our present study had 95.3% of the subject population with <20% risk score, where females were predominant in lower risk categories and males in the higher risk categories.
A study conducted in rural North India about cardiovascular risk assessment using WHO/ISH risk prediction charts found ≥10% risk among 44.4% of subjects, and this was found to be higher in females (59.3%) as compared with males (40.7%) and this difference was found to be statistically not significant. It was also reported that increased CVD risk was found to be statistically significant with diabetes.20 There is evidence of the validation of WHO/ISH risk prediction charts among Sri Lankan population which proved to have higher predictable values among males compared with females in all categories and is more predictable among females in low-risk categories. This could be explained by gender-specific factors such as menopause, hormonal imbalances, pregnancy-related complications, and polycystic ovarian syndrome, etc., which are not taken into the calculation of WHO/ISH risk prediction charts.21
The high percentage of participants categorized as having a low CVD risk of less than 10% in this study highlights the fact that there is a scope for its reduction by employing population-wide public health policy and an opportunity to utilize preventive services.
Measurement of CIMT to Predict the Risk of CVD According to Their Gender
The present study is similar to the findings of the study on “Gender difference in CIMT in type 2 diabetic patients: a 4-year follow-up study.” The mean values of CIMT were higher for males as compared with females. The study reported CIMT for men to be 0.762 ± 0.149 mm, while for women it was 0.723 ± 0.146 mm, p-value = 0.012.22
Similarly, in another study by Laboz-Rudnicka et al on “Impact of cardiovascular risk factors on CIMT: sex differences,” women had reduced levels of CIMT than men (0.54 vs. 0.60 mm, p = 0.011).23
A study conducted by Prasad et al on the prevalence and risk factors of silent myocardial ischemia in patients of T2DM revealed that mean CIMT in males was significantly higher than females (0.684 ± 0.034 and 0.663 ± 0.032 mm).24 This finding was similar to our study where males had higher CIMT compared with females.
The gender differences in CIMT are in line with other population studies where males showed higher values than the female population. It is also observed that patients with T2DM exhibit similar high CIMT values for males as compared with females. This is perhaps due to higher levels of systolic and diastolic BP, the prevalence of smoking, or reduced HDL.
Conclusions
Our study highlighted gender-specific differences with personal habits, waist circumference and BP, and biochemical measurements with low HDL, with WHO CVD risk assessment being higher among males compared with females. CVD risk was also significantly higher among males with the increased duration of diabetes, raised HbA1c, increased total cholesterol, decreased HDL, and elevated CIMT values. The menopausal status among women is another factor which increases the risk estimate. These findings open up a new pathway for future studies which stresses on other factors such as treatment intensity disparity apart from gender which plays a prominent role in preventive strategies of CVD.
Acknowledgments
We would extend our thanks to Shayara, laboratory technician for cooperation, and all the study participants for extending their support.
Conflict of Interest
None declared.
Funding This study was supported by Prajwalika Scholarship Scheme—Student 2021.
References
- Diabetes-related microvascular and macrovascular diseases in the physical therapy setting. Phys Ther. 2008;88(11):1322-1335.
- [Google Scholar]
- Prevalence of cardiovascular disease in type 2 diabetes: a systematic literature review of scientific evidence from across the world in 2007-2017. Cardiovasc Diabetol. 2018;17(01):83.
- [Google Scholar]
- Cardiovascular diseases in India: current epidemiology and future directions. Circulation. 2016;133(16):1605-1620.
- [Google Scholar]
- Microvasular and macrovascular complications in diabetes mellitus: distinct or continuum? Indian J Endocrinol Metab. 2016;20(04):546-551.
- [Google Scholar]
- Gender differences in determinants and consequences of health and illness. J Health Popul Nutr. 2007;25(01):47-61.
- [Google Scholar]
- Assessment of total cardiovascular risk using WHO/ISH risk prediction charts in three low and middle income countries in Asia. BMC Public Health. 2013;13:539.
- [Google Scholar]
- Appropriate body-mass index for Asian populations and its implications for policy and intervention strategies. Lancet. 2004;363:157-163. (9403):
- [Google Scholar]
- 2008. World Health Organization (WHO). Waist Circumference and Waist-Hip Ratio. Report of WHO Expert Consultation
- Use of carotid ultrasound to identify subclinical vascular disease and evaluate cardiovascular disease risk: a consensus statement from the American Society of Echocardiography Carotid Intima-Media Thickness Task Force. J Am Soc Echocardiogr. 2008;21(02):93-111. , quiz 189–190
- [Google Scholar]
- HEARTS technical package for cardiovascular disease management in primary health care: risk based CVD management. Geneva: World Health Organization; 2020. Accessed November 22, 2021 from:
- [Publisher] [Google Scholar]
- Executive summary of the third report of the National Cholesterol Education Program (NCEP) expert panel on detection, evaluation, and treatment of high blood cholesterol in adults (adult treatment panel III) JAMA. 2001;285(19):2486-2497.
- [Google Scholar]
- Gender differences in cardiovascular disease risk factors, treatments and complications in patients with type 2 diabetes: the RIACE Italian multicentre study. J Intern Med. 2013;274(02):176-191.
- [Google Scholar]
- Cardiovascular disease risk assessment and treatment among person with type 2 diabetes mellitus at the primary care level in rural central India. J Family Med Prim Care. 2020;9(04):2033-2039.
- [Google Scholar]
- Study of cardiovascular risk factors in patients of diabetes type 2 with special reference to sex differences. JMSCR. 2017;05(04):21105-21110.
- [CrossRef] [Google Scholar]
- Excess risk of fatal coronary heart disease associated with diabetes in men and women: meta-analysis of 37 prospective cohort studies. BMJ. 2006;332:73-78. (7533):
- [Google Scholar]
- Risk of all-cause mortality and vascular events in women versus men with type 1 diabetes: a systematic review and meta-analysis. Lancet Diabetes Endocrinol. 2015;3(03):198-206.
- [Google Scholar]
- Diabetes as risk factor for incident coronary heart disease in women compared with men: a systematic review and meta-analysis of 64 cohorts including 858,507 individuals and 28,203 coronary events. Diabetologia. 2014;57(08):1542-1551.
- [Google Scholar]
- Estimation of total cardiovascular risk using the 2019 WHO CVD prediction charts and comparison of population-level costs based on alternative drug therapy guidelines: a population-based study of adults in Bangladesh. BMJ Open. 2020;10(07):e035842.
- [Google Scholar]
- Cardiovascular risk assessment using WHO/ISH risk prediction charts in a rural area of North India. J Res Med Dent Sci. 2016;4(02):127-131.
- [Google Scholar]
- WHO package of essential noncommunicable (PEN) disease interventions for primary health care. World Health Organization. 2020. Accessed November 13, 2021 at:
- [Publisher] [Google Scholar]
- Validation of the World Health Organization/ International Society of Hypertension (WHO/ISH) cardiovascular risk predictions in Sri Lankans based on findings from a prospective cohort study. PLoS One. 2021;16(06):e0252267.
- [Google Scholar]
- Gender difference in carotid intima-media thickness in type 2 diabetic patients: a 4-year follow-up study. Cardiovasc Diabetol. 2012;11:51.
- [Google Scholar]
- Impact of cardiovascular risk factors on carotid intima-media thickness: sex differences. Clin Interv Aging. 2016;11:721-731.
- [Google Scholar]
- Prevalence and Risk factors for Silent Myocardial ischemia (PRISM): a clinico observational study in patients of type 2 diabetes. Indian Heart J. 2019;71(05):400-405.
- [Google Scholar]